Pima vs Serbian 3 or more Vehicles in Household
COMPARE
Pima
Serbian
3 or more Vehicles in Household
3 or more Vehicles in Household Comparison
Pima
Serbians
22.0%
3 OR MORE VEHICLES IN HOUSEHOLD
99.9/ 100
METRIC RATING
65th/ 347
METRIC RANK
19.1%
3 OR MORE VEHICLES IN HOUSEHOLD
24.0/ 100
METRIC RATING
194th/ 347
METRIC RANK
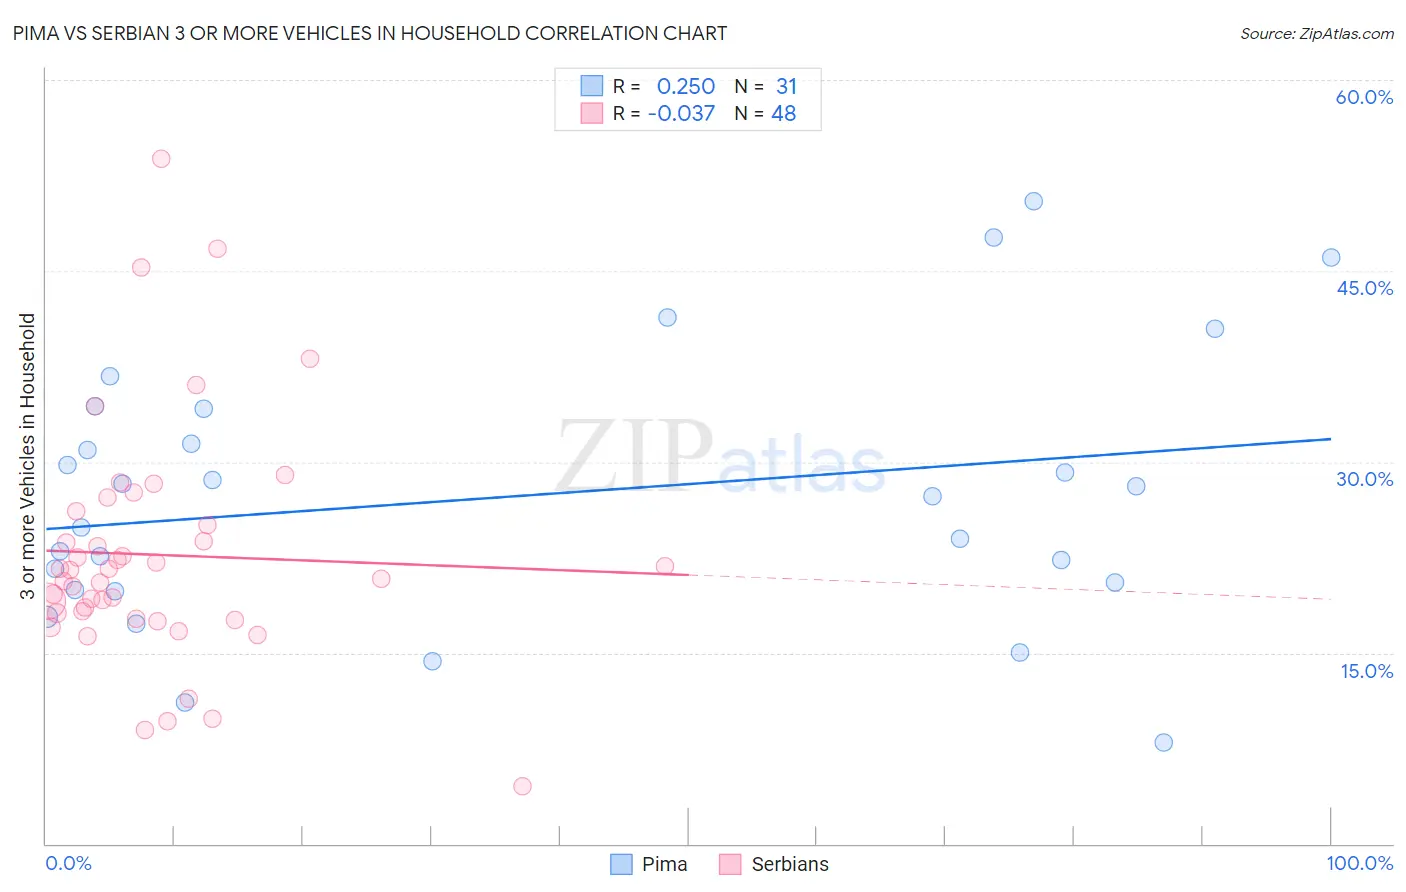
Pima vs Serbian 3 or more Vehicles in Household Correlation Chart
The statistical analysis conducted on geographies consisting of 61,538,722 people shows a weak positive correlation between the proportion of Pima and percentage of households with 3 or more vehicles available in the United States with a correlation coefficient (R) of 0.250 and weighted average of 22.0%. Similarly, the statistical analysis conducted on geographies consisting of 267,464,663 people shows no correlation between the proportion of Serbians and percentage of households with 3 or more vehicles available in the United States with a correlation coefficient (R) of -0.037 and weighted average of 19.1%, a difference of 15.5%.
3 or more Vehicles in Household Correlation Summary
| Measurement | Pima | Serbian |
| Minimum | 8.0% | 4.5% |
| Maximum | 50.5% | 53.8% |
| Range | 42.6% | 49.4% |
| Mean | 27.3% | 22.7% |
| Median | 27.3% | 21.2% |
| Interquartile 25% (IQ1) | 20.0% | 17.9% |
| Interquartile 75% (IQ3) | 34.1% | 25.6% |
| Interquartile Range (IQR) | 14.2% | 7.7% |
| Standard Deviation (Sample) | 10.5% | 9.4% |
| Standard Deviation (Population) | 10.3% | 9.3% |
Similar Demographics by 3 or more Vehicles in Household
Demographics Similar to Pima by 3 or more Vehicles in Household
In terms of 3 or more vehicles in household, the demographic groups most similar to Pima are Northern European (22.0%, a difference of 0.14%), Alaskan Athabascan (21.9%, a difference of 0.40%), Immigrants from Taiwan (22.1%, a difference of 0.42%), British (21.9%, a difference of 0.55%), and Creek (21.9%, a difference of 0.58%).
| Demographics | Rating | Rank | 3 or more Vehicles in Household |
| Spaniards | 100.0 /100 | #58 | Exceptional 22.3% |
| Navajo | 100.0 /100 | #59 | Exceptional 22.3% |
| Finns | 99.9 /100 | #60 | Exceptional 22.3% |
| Bhutanese | 99.9 /100 | #61 | Exceptional 22.2% |
| Fijians | 99.9 /100 | #62 | Exceptional 22.2% |
| Chickasaw | 99.9 /100 | #63 | Exceptional 22.2% |
| Immigrants | Taiwan | 99.9 /100 | #64 | Exceptional 22.1% |
| Pima | 99.9 /100 | #65 | Exceptional 22.0% |
| Northern Europeans | 99.9 /100 | #66 | Exceptional 22.0% |
| Alaskan Athabascans | 99.9 /100 | #67 | Exceptional 21.9% |
| British | 99.9 /100 | #68 | Exceptional 21.9% |
| Creek | 99.9 /100 | #69 | Exceptional 21.9% |
| Bangladeshis | 99.8 /100 | #70 | Exceptional 21.9% |
| Potawatomi | 99.8 /100 | #71 | Exceptional 21.9% |
| Portuguese | 99.8 /100 | #72 | Exceptional 21.8% |
Demographics Similar to Serbians by 3 or more Vehicles in Household
In terms of 3 or more vehicles in household, the demographic groups most similar to Serbians are Tsimshian (19.1%, a difference of 0.040%), Immigrants from Moldova (19.1%, a difference of 0.040%), Kenyan (19.1%, a difference of 0.080%), South American Indian (19.1%, a difference of 0.14%), and Immigrants from Zimbabwe (19.1%, a difference of 0.15%).
| Demographics | Rating | Rank | 3 or more Vehicles in Household |
| Immigrants | Hong Kong | 28.3 /100 | #187 | Fair 19.2% |
| Immigrants | Kuwait | 26.1 /100 | #188 | Fair 19.1% |
| Indians (Asian) | 26.0 /100 | #189 | Fair 19.1% |
| Immigrants | Zimbabwe | 25.5 /100 | #190 | Fair 19.1% |
| South American Indians | 25.4 /100 | #191 | Fair 19.1% |
| Kenyans | 24.7 /100 | #192 | Fair 19.1% |
| Tsimshian | 24.4 /100 | #193 | Fair 19.1% |
| Serbians | 24.0 /100 | #194 | Fair 19.1% |
| Immigrants | Moldova | 23.6 /100 | #195 | Fair 19.1% |
| Central American Indians | 22.2 /100 | #196 | Fair 19.0% |
| Immigrants | Japan | 22.0 /100 | #197 | Fair 19.0% |
| Egyptians | 19.5 /100 | #198 | Poor 19.0% |
| Immigrants | Norway | 19.0 /100 | #199 | Poor 19.0% |
| Argentineans | 18.2 /100 | #200 | Poor 18.9% |
| Arabs | 17.7 /100 | #201 | Poor 18.9% |