Pima vs Serbian Disability Age 18 to 34
COMPARE
Pima
Serbian
Disability Age 18 to 34
Disability Age 18 to 34 Comparison
Pima
Serbians
7.7%
DISABILITY AGE 18 TO 34
0.0/ 100
METRIC RATING
301st/ 347
METRIC RANK
6.9%
DISABILITY AGE 18 TO 34
8.2/ 100
METRIC RATING
214th/ 347
METRIC RANK
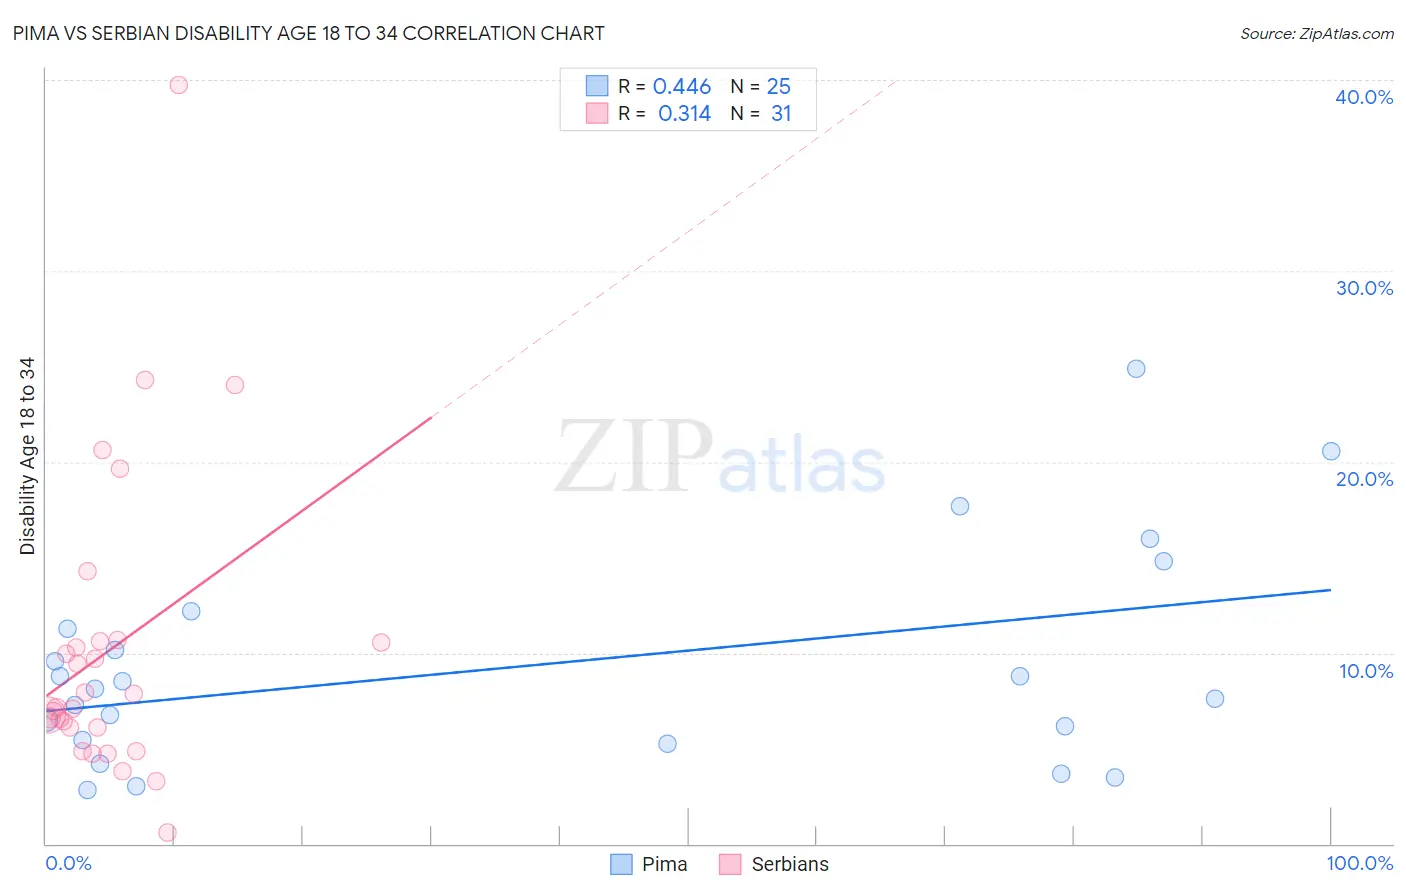
Pima vs Serbian Disability Age 18 to 34 Correlation Chart
The statistical analysis conducted on geographies consisting of 61,478,935 people shows a moderate positive correlation between the proportion of Pima and percentage of population with a disability between the ages 18 and 35 in the United States with a correlation coefficient (R) of 0.446 and weighted average of 7.7%. Similarly, the statistical analysis conducted on geographies consisting of 267,177,394 people shows a mild positive correlation between the proportion of Serbians and percentage of population with a disability between the ages 18 and 35 in the United States with a correlation coefficient (R) of 0.314 and weighted average of 6.9%, a difference of 12.5%.
Disability Age 18 to 34 Correlation Summary
| Measurement | Pima | Serbian |
| Minimum | 2.8% | 0.58% |
| Maximum | 24.9% | 39.8% |
| Range | 22.1% | 39.2% |
| Mean | 9.3% | 10.2% |
| Median | 8.1% | 7.1% |
| Interquartile 25% (IQ1) | 5.3% | 6.1% |
| Interquartile 75% (IQ3) | 11.7% | 10.6% |
| Interquartile Range (IQR) | 6.4% | 4.5% |
| Standard Deviation (Sample) | 5.7% | 8.0% |
| Standard Deviation (Population) | 5.5% | 7.8% |
Similar Demographics by Disability Age 18 to 34
Demographics Similar to Pima by Disability Age 18 to 34
In terms of disability age 18 to 34, the demographic groups most similar to Pima are Scottish (7.7%, a difference of 0.060%), Welsh (7.7%, a difference of 0.070%), German (7.7%, a difference of 0.080%), Cheyenne (7.7%, a difference of 0.14%), and Dutch (7.7%, a difference of 0.31%).
| Demographics | Rating | Rank | Disability Age 18 to 34 |
| Immigrants | Cabo Verde | 0.0 /100 | #294 | Tragic 7.7% |
| Tlingit-Haida | 0.0 /100 | #295 | Tragic 7.7% |
| Cape Verdeans | 0.0 /100 | #296 | Tragic 7.7% |
| Pueblo | 0.0 /100 | #297 | Tragic 7.7% |
| Dutch | 0.0 /100 | #298 | Tragic 7.7% |
| Germans | 0.0 /100 | #299 | Tragic 7.7% |
| Scottish | 0.0 /100 | #300 | Tragic 7.7% |
| Pima | 0.0 /100 | #301 | Tragic 7.7% |
| Welsh | 0.0 /100 | #302 | Tragic 7.7% |
| Cheyenne | 0.0 /100 | #303 | Tragic 7.7% |
| Shoshone | 0.0 /100 | #304 | Tragic 7.8% |
| Menominee | 0.0 /100 | #305 | Tragic 7.8% |
| English | 0.0 /100 | #306 | Tragic 7.8% |
| Scotch-Irish | 0.0 /100 | #307 | Tragic 7.8% |
| Pennsylvania Germans | 0.0 /100 | #308 | Tragic 7.8% |
Demographics Similar to Serbians by Disability Age 18 to 34
In terms of disability age 18 to 34, the demographic groups most similar to Serbians are Immigrants from Thailand (6.9%, a difference of 0.16%), Immigrants from Western Europe (6.9%, a difference of 0.18%), Luxembourger (6.9%, a difference of 0.25%), Sudanese (6.9%, a difference of 0.29%), and Immigrants from Kenya (6.9%, a difference of 0.31%).
| Demographics | Rating | Rank | Disability Age 18 to 34 |
| Mexicans | 12.6 /100 | #207 | Poor 6.8% |
| Immigrants | Scotland | 12.4 /100 | #208 | Poor 6.8% |
| Immigrants | Burma/Myanmar | 12.3 /100 | #209 | Poor 6.8% |
| Latvians | 11.1 /100 | #210 | Poor 6.8% |
| Immigrants | Norway | 10.0 /100 | #211 | Tragic 6.8% |
| Luxembourgers | 9.4 /100 | #212 | Tragic 6.9% |
| Immigrants | Western Europe | 9.1 /100 | #213 | Tragic 6.9% |
| Serbians | 8.2 /100 | #214 | Tragic 6.9% |
| Immigrants | Thailand | 7.5 /100 | #215 | Tragic 6.9% |
| Sudanese | 7.0 /100 | #216 | Tragic 6.9% |
| Immigrants | Kenya | 6.9 /100 | #217 | Tragic 6.9% |
| Ukrainians | 6.7 /100 | #218 | Tragic 6.9% |
| Hawaiians | 6.5 /100 | #219 | Tragic 6.9% |
| Immigrants | Senegal | 5.5 /100 | #220 | Tragic 6.9% |
| Immigrants | Middle Africa | 5.5 /100 | #221 | Tragic 6.9% |