Bermudan vs Serbian 3 or more Vehicles in Household
COMPARE
Bermudan
Serbian
3 or more Vehicles in Household
3 or more Vehicles in Household Comparison
Bermudans
Serbians
17.8%
3 OR MORE VEHICLES IN HOUSEHOLD
0.9/ 100
METRIC RATING
263rd/ 347
METRIC RANK
19.1%
3 OR MORE VEHICLES IN HOUSEHOLD
24.0/ 100
METRIC RATING
194th/ 347
METRIC RANK
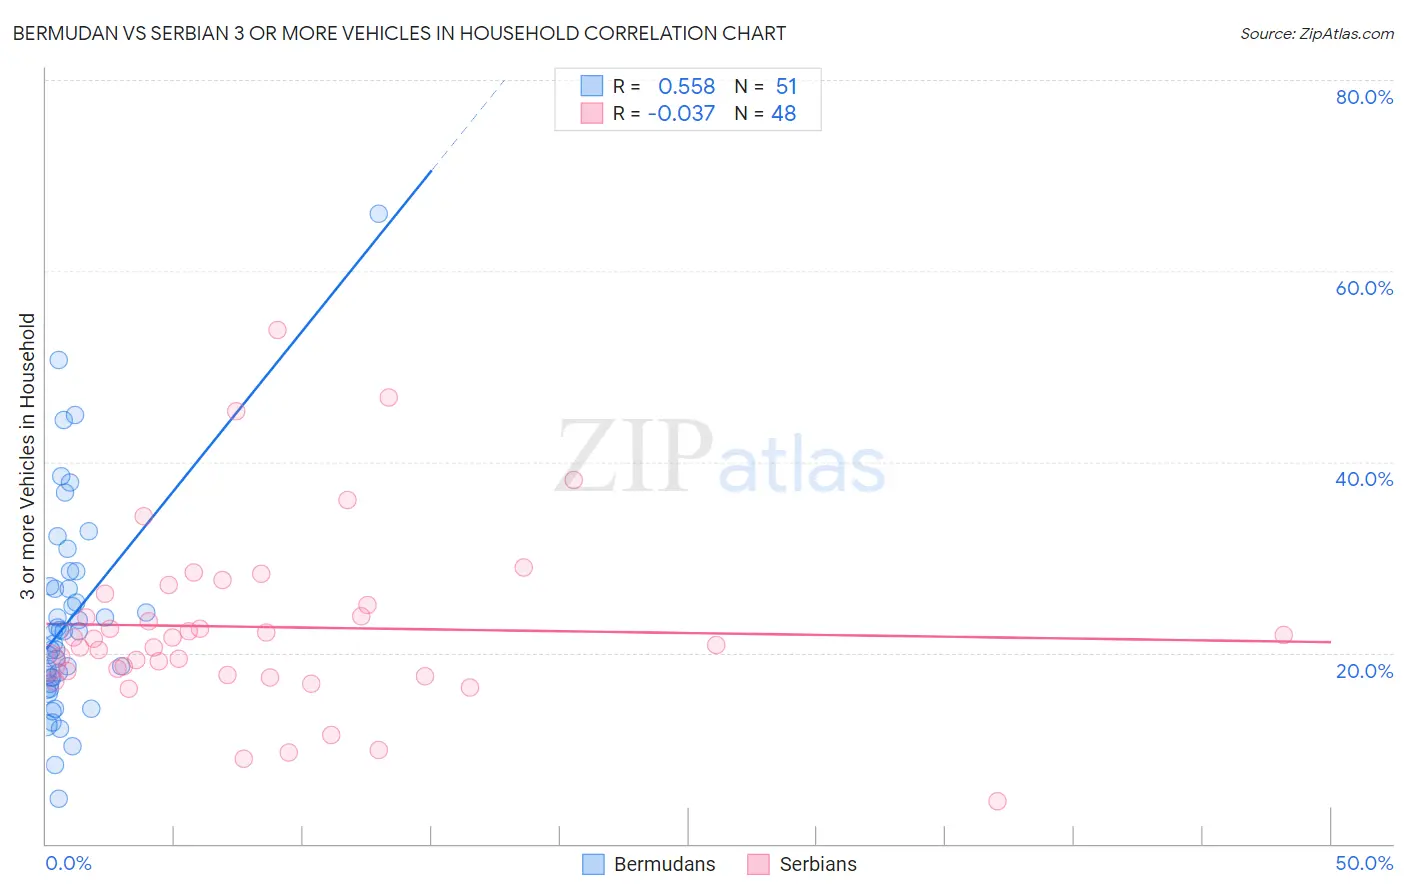
Bermudan vs Serbian 3 or more Vehicles in Household Correlation Chart
The statistical analysis conducted on geographies consisting of 55,710,520 people shows a substantial positive correlation between the proportion of Bermudans and percentage of households with 3 or more vehicles available in the United States with a correlation coefficient (R) of 0.558 and weighted average of 17.8%. Similarly, the statistical analysis conducted on geographies consisting of 267,464,663 people shows no correlation between the proportion of Serbians and percentage of households with 3 or more vehicles available in the United States with a correlation coefficient (R) of -0.037 and weighted average of 19.1%, a difference of 7.4%.
3 or more Vehicles in Household Correlation Summary
| Measurement | Bermudan | Serbian |
| Minimum | 4.8% | 4.5% |
| Maximum | 66.0% | 53.8% |
| Range | 61.2% | 49.4% |
| Mean | 23.6% | 22.7% |
| Median | 22.1% | 21.2% |
| Interquartile 25% (IQ1) | 16.7% | 17.9% |
| Interquartile 75% (IQ3) | 27.0% | 25.6% |
| Interquartile Range (IQR) | 10.3% | 7.7% |
| Standard Deviation (Sample) | 11.2% | 9.4% |
| Standard Deviation (Population) | 11.1% | 9.3% |
Similar Demographics by 3 or more Vehicles in Household
Demographics Similar to Bermudans by 3 or more Vehicles in Household
In terms of 3 or more vehicles in household, the demographic groups most similar to Bermudans are Cambodian (17.8%, a difference of 0.030%), Colombian (17.8%, a difference of 0.11%), Immigrants from Northern Africa (17.8%, a difference of 0.14%), Ugandan (17.8%, a difference of 0.16%), and Immigrants from Panama (17.7%, a difference of 0.16%).
| Demographics | Rating | Rank | 3 or more Vehicles in Household |
| Sub-Saharan Africans | 1.1 /100 | #256 | Tragic 17.9% |
| Immigrants | Eritrea | 1.1 /100 | #257 | Tragic 17.8% |
| Sudanese | 1.1 /100 | #258 | Tragic 17.8% |
| Uruguayans | 1.0 /100 | #259 | Tragic 17.8% |
| Ugandans | 0.9 /100 | #260 | Tragic 17.8% |
| Immigrants | Northern Africa | 0.9 /100 | #261 | Tragic 17.8% |
| Colombians | 0.9 /100 | #262 | Tragic 17.8% |
| Bermudans | 0.9 /100 | #263 | Tragic 17.8% |
| Cambodians | 0.9 /100 | #264 | Tragic 17.8% |
| Immigrants | Panama | 0.8 /100 | #265 | Tragic 17.7% |
| Macedonians | 0.8 /100 | #266 | Tragic 17.7% |
| Immigrants | Venezuela | 0.8 /100 | #267 | Tragic 17.7% |
| Immigrants | Bulgaria | 0.8 /100 | #268 | Tragic 17.7% |
| Immigrants | France | 0.6 /100 | #269 | Tragic 17.6% |
| Immigrants | Nepal | 0.6 /100 | #270 | Tragic 17.6% |
Demographics Similar to Serbians by 3 or more Vehicles in Household
In terms of 3 or more vehicles in household, the demographic groups most similar to Serbians are Tsimshian (19.1%, a difference of 0.040%), Immigrants from Moldova (19.1%, a difference of 0.040%), Kenyan (19.1%, a difference of 0.080%), South American Indian (19.1%, a difference of 0.14%), and Immigrants from Zimbabwe (19.1%, a difference of 0.15%).
| Demographics | Rating | Rank | 3 or more Vehicles in Household |
| Immigrants | Hong Kong | 28.3 /100 | #187 | Fair 19.2% |
| Immigrants | Kuwait | 26.1 /100 | #188 | Fair 19.1% |
| Indians (Asian) | 26.0 /100 | #189 | Fair 19.1% |
| Immigrants | Zimbabwe | 25.5 /100 | #190 | Fair 19.1% |
| South American Indians | 25.4 /100 | #191 | Fair 19.1% |
| Kenyans | 24.7 /100 | #192 | Fair 19.1% |
| Tsimshian | 24.4 /100 | #193 | Fair 19.1% |
| Serbians | 24.0 /100 | #194 | Fair 19.1% |
| Immigrants | Moldova | 23.6 /100 | #195 | Fair 19.1% |
| Central American Indians | 22.2 /100 | #196 | Fair 19.0% |
| Immigrants | Japan | 22.0 /100 | #197 | Fair 19.0% |
| Egyptians | 19.5 /100 | #198 | Poor 19.0% |
| Immigrants | Norway | 19.0 /100 | #199 | Poor 19.0% |
| Argentineans | 18.2 /100 | #200 | Poor 18.9% |
| Arabs | 17.7 /100 | #201 | Poor 18.9% |