Pima vs Serbian Master's Degree
COMPARE
Pima
Serbian
Master's Degree
Master's Degree Comparison
Pima
Serbians
9.2%
MASTER'S DEGREE
0.0/ 100
METRIC RATING
344th/ 347
METRIC RANK
16.1%
MASTER'S DEGREE
91.7/ 100
METRIC RATING
132nd/ 347
METRIC RANK
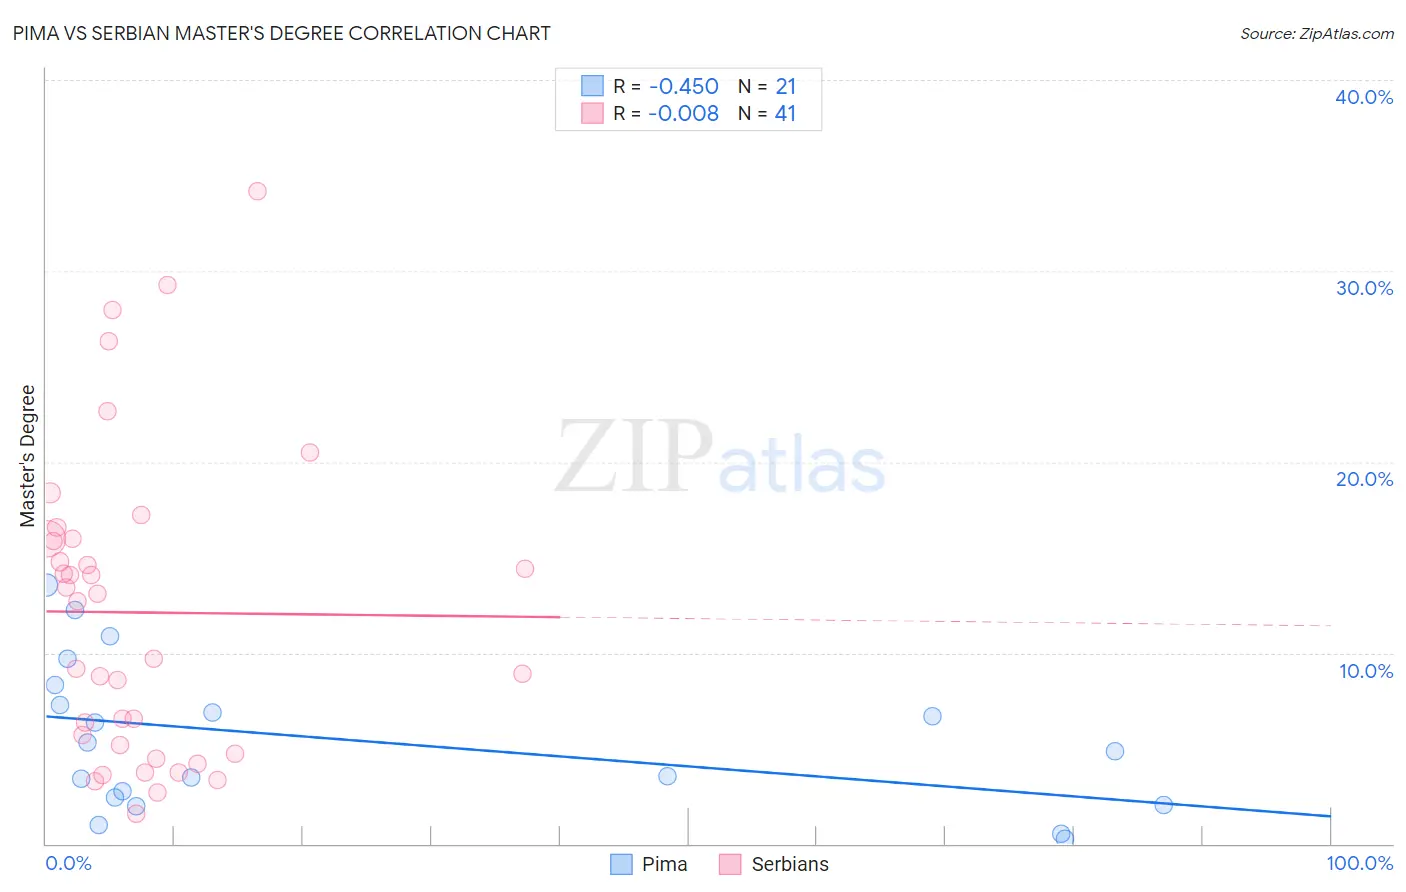
Pima vs Serbian Master's Degree Correlation Chart
The statistical analysis conducted on geographies consisting of 61,537,542 people shows a moderate negative correlation between the proportion of Pima and percentage of population with at least master's degree education in the United States with a correlation coefficient (R) of -0.450 and weighted average of 9.2%. Similarly, the statistical analysis conducted on geographies consisting of 267,595,845 people shows no correlation between the proportion of Serbians and percentage of population with at least master's degree education in the United States with a correlation coefficient (R) of -0.008 and weighted average of 16.1%, a difference of 73.7%.
Master's Degree Correlation Summary
| Measurement | Pima | Serbian |
| Minimum | 0.28% | 1.5% |
| Maximum | 13.6% | 34.2% |
| Range | 13.3% | 32.6% |
| Mean | 5.4% | 12.1% |
| Median | 4.8% | 12.7% |
| Interquartile 25% (IQ1) | 2.2% | 5.0% |
| Interquartile 75% (IQ3) | 7.8% | 16.0% |
| Interquartile Range (IQR) | 5.6% | 11.0% |
| Standard Deviation (Sample) | 3.9% | 8.0% |
| Standard Deviation (Population) | 3.8% | 7.9% |
Similar Demographics by Master's Degree
Demographics Similar to Pima by Master's Degree
In terms of master's degree, the demographic groups most similar to Pima are Yuman (9.2%, a difference of 0.15%), Lumbee (9.3%, a difference of 0.17%), Immigrants from Mexico (9.3%, a difference of 0.65%), Navajo (9.4%, a difference of 1.9%), and Yakama (9.5%, a difference of 2.3%).
| Demographics | Rating | Rank | Master's Degree |
| Menominee | 0.0 /100 | #333 | Tragic 10.2% |
| Arapaho | 0.0 /100 | #334 | Tragic 10.0% |
| Immigrants | Central America | 0.0 /100 | #335 | Tragic 10.0% |
| Natives/Alaskans | 0.0 /100 | #336 | Tragic 9.9% |
| Mexicans | 0.0 /100 | #337 | Tragic 9.7% |
| Tohono O'odham | 0.0 /100 | #338 | Tragic 9.7% |
| Spanish American Indians | 0.0 /100 | #339 | Tragic 9.6% |
| Yakama | 0.0 /100 | #340 | Tragic 9.5% |
| Navajo | 0.0 /100 | #341 | Tragic 9.4% |
| Immigrants | Mexico | 0.0 /100 | #342 | Tragic 9.3% |
| Lumbee | 0.0 /100 | #343 | Tragic 9.3% |
| Pima | 0.0 /100 | #344 | Tragic 9.2% |
| Yuman | 0.0 /100 | #345 | Tragic 9.2% |
| Yup'ik | 0.0 /100 | #346 | Tragic 8.5% |
| Houma | 0.0 /100 | #347 | Tragic 7.9% |
Demographics Similar to Serbians by Master's Degree
In terms of master's degree, the demographic groups most similar to Serbians are Taiwanese (16.1%, a difference of 0.090%), Immigrants from Jordan (16.1%, a difference of 0.41%), Immigrants from Sudan (16.0%, a difference of 0.54%), Immigrants from Syria (16.2%, a difference of 0.67%), and Venezuelan (15.9%, a difference of 1.1%).
| Demographics | Rating | Rank | Master's Degree |
| Italians | 95.4 /100 | #125 | Exceptional 16.4% |
| Immigrants | Eastern Africa | 95.2 /100 | #126 | Exceptional 16.3% |
| Palestinians | 94.8 /100 | #127 | Exceptional 16.3% |
| Immigrants | Sierra Leone | 94.7 /100 | #128 | Exceptional 16.3% |
| Immigrants | Syria | 93.3 /100 | #129 | Exceptional 16.2% |
| Immigrants | Jordan | 92.7 /100 | #130 | Exceptional 16.1% |
| Taiwanese | 91.9 /100 | #131 | Exceptional 16.1% |
| Serbians | 91.7 /100 | #132 | Exceptional 16.1% |
| Immigrants | Sudan | 90.2 /100 | #133 | Exceptional 16.0% |
| Venezuelans | 88.4 /100 | #134 | Excellent 15.9% |
| South American Indians | 88.4 /100 | #135 | Excellent 15.9% |
| Assyrians/Chaldeans/Syriacs | 86.8 /100 | #136 | Excellent 15.8% |
| Europeans | 86.4 /100 | #137 | Excellent 15.8% |
| Pakistanis | 86.1 /100 | #138 | Excellent 15.8% |
| Immigrants | Germany | 85.9 /100 | #139 | Excellent 15.8% |