Pakistani vs Immigrants from Czechoslovakia Median Earnings
COMPARE
Pakistani
Immigrants from Czechoslovakia
Median Earnings
Median Earnings Comparison
Pakistanis
Immigrants from Czechoslovakia
$48,254
MEDIAN EARNINGS
92.8/ 100
METRIC RATING
129th/ 347
METRIC RANK
$52,361
MEDIAN EARNINGS
100.0/ 100
METRIC RATING
45th/ 347
METRIC RANK
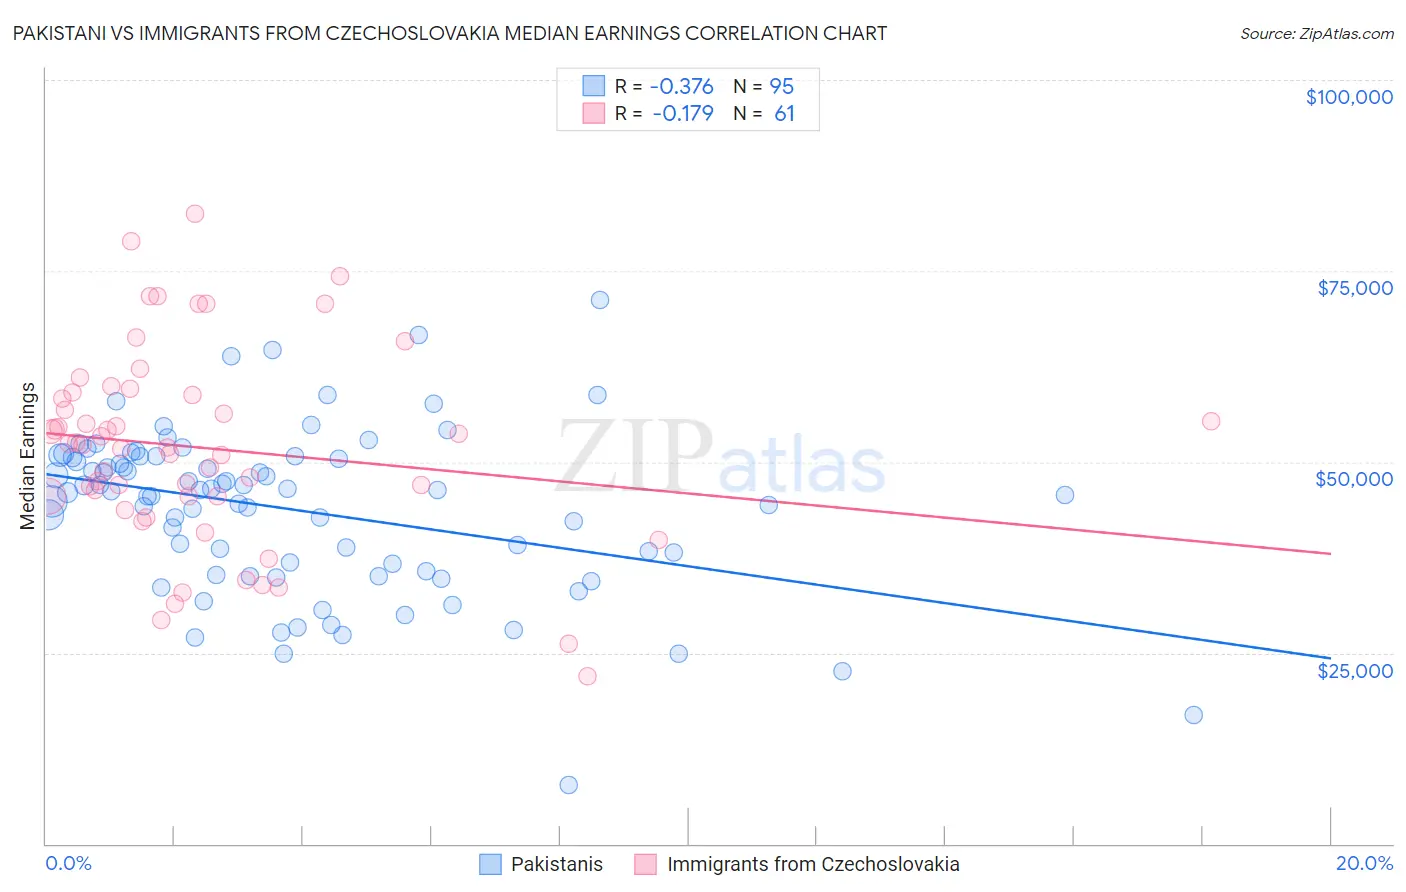
Pakistani vs Immigrants from Czechoslovakia Median Earnings Correlation Chart
The statistical analysis conducted on geographies consisting of 335,344,487 people shows a mild negative correlation between the proportion of Pakistanis and median earnings in the United States with a correlation coefficient (R) of -0.376 and weighted average of $48,254. Similarly, the statistical analysis conducted on geographies consisting of 195,449,585 people shows a poor negative correlation between the proportion of Immigrants from Czechoslovakia and median earnings in the United States with a correlation coefficient (R) of -0.179 and weighted average of $52,361, a difference of 8.5%.
Median Earnings Correlation Summary
| Measurement | Pakistani | Immigrants from Czechoslovakia |
| Minimum | $7,703 | $21,875 |
| Maximum | $71,250 | $82,450 |
| Range | $63,547 | $60,575 |
| Mean | $43,723 | $51,817 |
| Median | $46,169 | $52,166 |
| Interquartile 25% (IQ1) | $35,714 | $45,495 |
| Interquartile 75% (IQ3) | $50,670 | $58,910 |
| Interquartile Range (IQR) | $14,956 | $13,415 |
| Standard Deviation (Sample) | $10,826 | $12,779 |
| Standard Deviation (Population) | $10,769 | $12,674 |
Similar Demographics by Median Earnings
Demographics Similar to Pakistanis by Median Earnings
In terms of median earnings, the demographic groups most similar to Pakistanis are Immigrants from Philippines ($48,266, a difference of 0.020%), Zimbabwean ($48,229, a difference of 0.050%), Lebanese ($48,226, a difference of 0.060%), Sierra Leonean ($48,286, a difference of 0.070%), and Assyrian/Chaldean/Syriac ($48,304, a difference of 0.10%).
| Demographics | Rating | Rank | Median Earnings |
| Chileans | 94.8 /100 | #122 | Exceptional $48,504 |
| Immigrants | Syria | 93.9 /100 | #123 | Exceptional $48,375 |
| Brazilians | 93.7 /100 | #124 | Exceptional $48,356 |
| Immigrants | Fiji | 93.3 /100 | #125 | Exceptional $48,305 |
| Assyrians/Chaldeans/Syriacs | 93.3 /100 | #126 | Exceptional $48,304 |
| Sierra Leoneans | 93.1 /100 | #127 | Exceptional $48,286 |
| Immigrants | Philippines | 92.9 /100 | #128 | Exceptional $48,266 |
| Pakistanis | 92.8 /100 | #129 | Exceptional $48,254 |
| Zimbabweans | 92.6 /100 | #130 | Exceptional $48,229 |
| Lebanese | 92.5 /100 | #131 | Exceptional $48,226 |
| British | 92.2 /100 | #132 | Exceptional $48,189 |
| Immigrants | Uganda | 90.5 /100 | #133 | Exceptional $48,041 |
| Sri Lankans | 90.5 /100 | #134 | Exceptional $48,040 |
| Portuguese | 90.4 /100 | #135 | Exceptional $48,032 |
| Slovenes | 90.0 /100 | #136 | Excellent $47,995 |
Demographics Similar to Immigrants from Czechoslovakia by Median Earnings
In terms of median earnings, the demographic groups most similar to Immigrants from Czechoslovakia are Bhutanese ($52,297, a difference of 0.12%), Australian ($52,294, a difference of 0.13%), Immigrants from Malaysia ($52,514, a difference of 0.29%), Bulgarian ($52,512, a difference of 0.29%), and Maltese ($52,526, a difference of 0.31%).
| Demographics | Rating | Rank | Median Earnings |
| Latvians | 100.0 /100 | #38 | Exceptional $53,001 |
| Immigrants | Turkey | 100.0 /100 | #39 | Exceptional $52,960 |
| Israelis | 100.0 /100 | #40 | Exceptional $52,937 |
| Immigrants | Lithuania | 100.0 /100 | #41 | Exceptional $52,769 |
| Maltese | 100.0 /100 | #42 | Exceptional $52,526 |
| Immigrants | Malaysia | 100.0 /100 | #43 | Exceptional $52,514 |
| Bulgarians | 100.0 /100 | #44 | Exceptional $52,512 |
| Immigrants | Czechoslovakia | 100.0 /100 | #45 | Exceptional $52,361 |
| Bhutanese | 100.0 /100 | #46 | Exceptional $52,297 |
| Australians | 100.0 /100 | #47 | Exceptional $52,294 |
| Immigrants | Europe | 100.0 /100 | #48 | Exceptional $52,195 |
| Bolivians | 100.0 /100 | #49 | Exceptional $52,005 |
| Immigrants | South Africa | 100.0 /100 | #50 | Exceptional $51,850 |
| Immigrants | Austria | 99.9 /100 | #51 | Exceptional $51,826 |
| Estonians | 99.9 /100 | #52 | Exceptional $51,772 |