Pakistani vs French American Indian 2 or more Vehicles in Household
COMPARE
Pakistani
French American Indian
2 or more Vehicles in Household
2 or more Vehicles in Household Comparison
Pakistanis
French American Indians
57.9%
2 OR MORE VEHICLES IN HOUSEHOLD
99.0/ 100
METRIC RATING
91st/ 347
METRIC RANK
55.5%
2 OR MORE VEHICLES IN HOUSEHOLD
56.7/ 100
METRIC RATING
168th/ 347
METRIC RANK
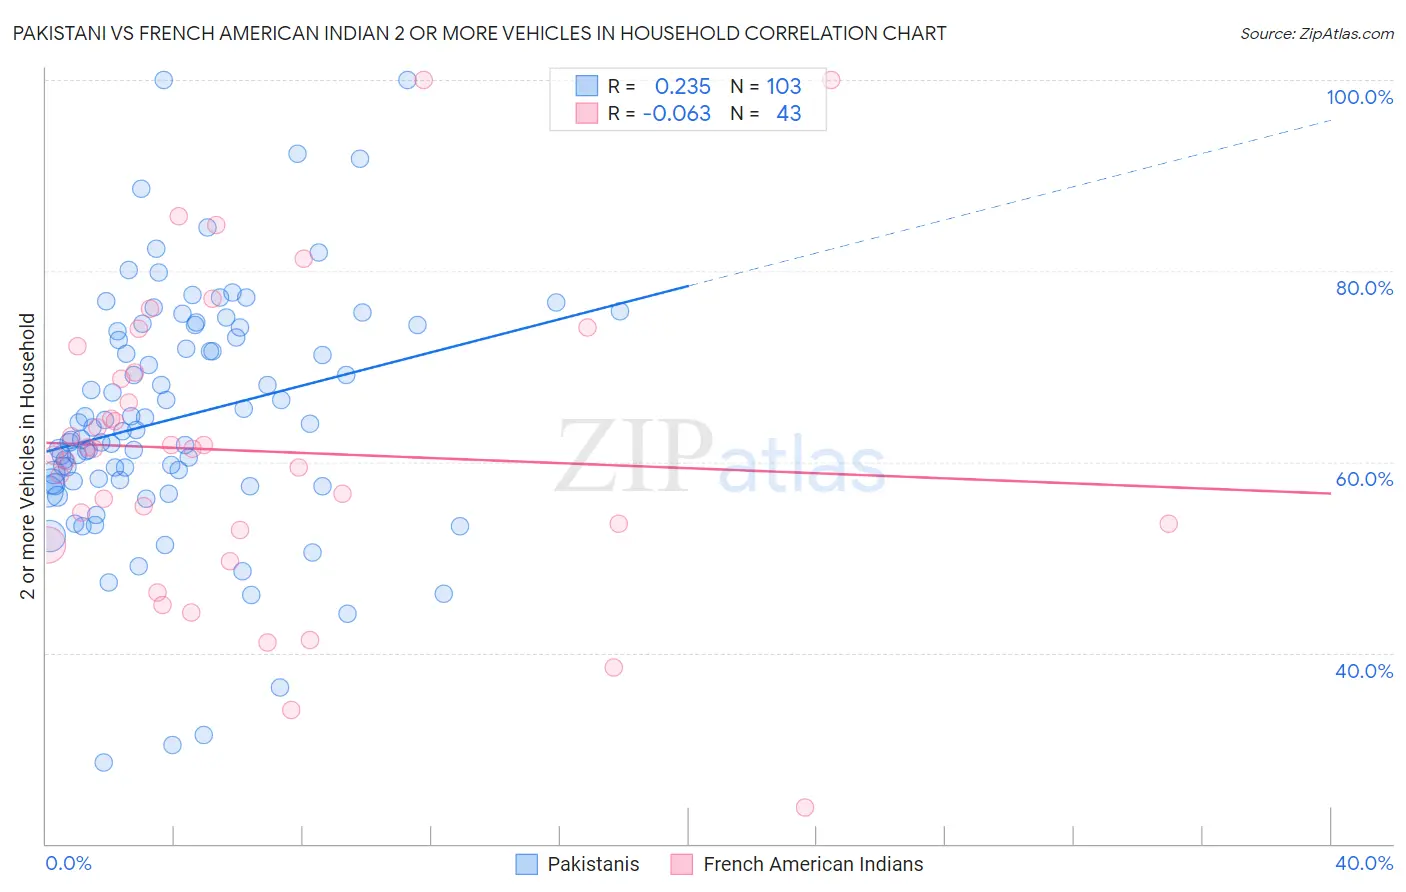
Pakistani vs French American Indian 2 or more Vehicles in Household Correlation Chart
The statistical analysis conducted on geographies consisting of 335,209,780 people shows a weak positive correlation between the proportion of Pakistanis and percentage of households with 2 or more vehicles available in the United States with a correlation coefficient (R) of 0.235 and weighted average of 57.9%. Similarly, the statistical analysis conducted on geographies consisting of 131,972,181 people shows a slight negative correlation between the proportion of French American Indians and percentage of households with 2 or more vehicles available in the United States with a correlation coefficient (R) of -0.063 and weighted average of 55.5%, a difference of 4.3%.
2 or more Vehicles in Household Correlation Summary
| Measurement | Pakistani | French American Indian |
| Minimum | 28.5% | 23.7% |
| Maximum | 100.0% | 100.0% |
| Range | 71.5% | 76.2% |
| Mean | 64.7% | 61.1% |
| Median | 63.3% | 61.3% |
| Interquartile 25% (IQ1) | 57.9% | 52.9% |
| Interquartile 75% (IQ3) | 74.1% | 69.4% |
| Interquartile Range (IQR) | 16.1% | 16.5% |
| Standard Deviation (Sample) | 12.9% | 15.8% |
| Standard Deviation (Population) | 12.9% | 15.6% |
Similar Demographics by 2 or more Vehicles in Household
Demographics Similar to Pakistanis by 2 or more Vehicles in Household
In terms of 2 or more vehicles in household, the demographic groups most similar to Pakistanis are Shoshone (57.9%, a difference of 0.020%), Immigrants from Germany (57.9%, a difference of 0.030%), Hispanic or Latino (57.9%, a difference of 0.030%), Ottawa (57.9%, a difference of 0.030%), and Immigrants from Iran (57.9%, a difference of 0.090%).
| Demographics | Rating | Rank | 2 or more Vehicles in Household |
| Maltese | 99.2 /100 | #84 | Exceptional 58.0% |
| Slovaks | 99.2 /100 | #85 | Exceptional 58.0% |
| Potawatomi | 99.1 /100 | #86 | Exceptional 58.0% |
| Thais | 99.1 /100 | #87 | Exceptional 57.9% |
| Immigrants | Iran | 99.1 /100 | #88 | Exceptional 57.9% |
| Immigrants | Germany | 99.0 /100 | #89 | Exceptional 57.9% |
| Hispanics or Latinos | 99.0 /100 | #90 | Exceptional 57.9% |
| Pakistanis | 99.0 /100 | #91 | Exceptional 57.9% |
| Shoshone | 99.0 /100 | #92 | Exceptional 57.9% |
| Ottawa | 99.0 /100 | #93 | Exceptional 57.9% |
| Filipinos | 98.9 /100 | #94 | Exceptional 57.8% |
| Hmong | 98.9 /100 | #95 | Exceptional 57.8% |
| Burmese | 98.8 /100 | #96 | Exceptional 57.8% |
| Slavs | 98.8 /100 | #97 | Exceptional 57.8% |
| Palestinians | 98.6 /100 | #98 | Exceptional 57.7% |
Demographics Similar to French American Indians by 2 or more Vehicles in Household
In terms of 2 or more vehicles in household, the demographic groups most similar to French American Indians are Immigrants from Austria (55.5%, a difference of 0.010%), Romanian (55.5%, a difference of 0.030%), Kenyan (55.5%, a difference of 0.060%), Immigrants from Sri Lanka (55.5%, a difference of 0.070%), and Immigrants from Costa Rica (55.4%, a difference of 0.090%).
| Demographics | Rating | Rank | 2 or more Vehicles in Household |
| Colville | 61.1 /100 | #161 | Good 55.6% |
| German Russians | 60.9 /100 | #162 | Good 55.6% |
| Immigrants | Zimbabwe | 60.2 /100 | #163 | Good 55.6% |
| Dutch West Indians | 59.8 /100 | #164 | Average 55.6% |
| Immigrants | El Salvador | 59.4 /100 | #165 | Average 55.6% |
| Immigrants | Sri Lanka | 58.3 /100 | #166 | Average 55.5% |
| Kenyans | 58.1 /100 | #167 | Average 55.5% |
| French American Indians | 56.7 /100 | #168 | Average 55.5% |
| Immigrants | Austria | 56.3 /100 | #169 | Average 55.5% |
| Romanians | 55.8 /100 | #170 | Average 55.5% |
| Immigrants | Costa Rica | 54.4 /100 | #171 | Average 55.4% |
| Immigrants | Nicaragua | 51.6 /100 | #172 | Average 55.4% |
| Immigrants | Western Europe | 51.4 /100 | #173 | Average 55.4% |
| Navajo | 50.0 /100 | #174 | Average 55.3% |
| Immigrants | Denmark | 49.4 /100 | #175 | Average 55.3% |