Pakistani vs Immigrants from Czechoslovakia Vision Disability
COMPARE
Pakistani
Immigrants from Czechoslovakia
Vision Disability
Vision Disability Comparison
Pakistanis
Immigrants from Czechoslovakia
2.1%
VISION DISABILITY
71.6/ 100
METRIC RATING
156th/ 347
METRIC RANK
2.0%
VISION DISABILITY
98.7/ 100
METRIC RATING
68th/ 347
METRIC RANK
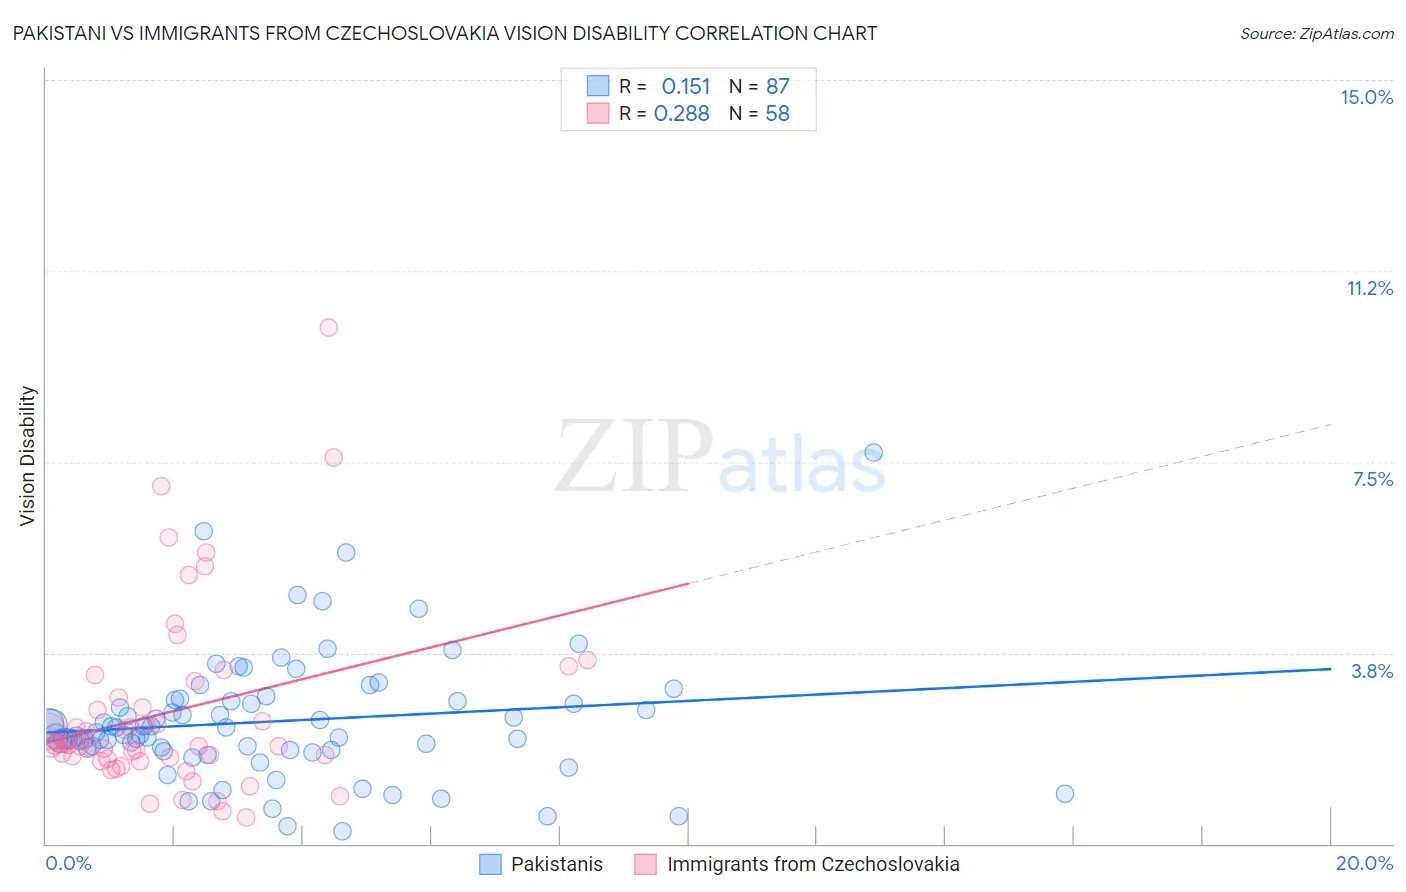
Pakistani vs Immigrants from Czechoslovakia Vision Disability Correlation Chart
The statistical analysis conducted on geographies consisting of 335,131,498 people shows a poor positive correlation between the proportion of Pakistanis and percentage of population with vision disability in the United States with a correlation coefficient (R) of 0.151 and weighted average of 2.1%. Similarly, the statistical analysis conducted on geographies consisting of 195,413,823 people shows a weak positive correlation between the proportion of Immigrants from Czechoslovakia and percentage of population with vision disability in the United States with a correlation coefficient (R) of 0.288 and weighted average of 2.0%, a difference of 5.8%.
Vision Disability Correlation Summary
| Measurement | Pakistani | Immigrants from Czechoslovakia |
| Minimum | 0.26% | 0.52% |
| Maximum | 7.7% | 10.1% |
| Range | 7.4% | 9.6% |
| Mean | 2.4% | 2.6% |
| Median | 2.1% | 1.9% |
| Interquartile 25% (IQ1) | 1.8% | 1.7% |
| Interquartile 75% (IQ3) | 2.8% | 2.9% |
| Interquartile Range (IQR) | 0.96% | 1.2% |
| Standard Deviation (Sample) | 1.2% | 1.8% |
| Standard Deviation (Population) | 1.2% | 1.8% |
Similar Demographics by Vision Disability
Demographics Similar to Pakistanis by Vision Disability
In terms of vision disability, the demographic groups most similar to Pakistanis are Immigrants from Colombia (2.1%, a difference of 0.040%), Serbian (2.1%, a difference of 0.11%), Immigrants from Uzbekistan (2.1%, a difference of 0.13%), South African (2.1%, a difference of 0.14%), and Slovene (2.1%, a difference of 0.16%).
| Demographics | Rating | Rank | Vision Disability |
| Colombians | 76.2 /100 | #149 | Good 2.1% |
| Belgians | 75.9 /100 | #150 | Good 2.1% |
| Immigrants | Norway | 75.5 /100 | #151 | Good 2.1% |
| Immigrants | Southern Europe | 74.6 /100 | #152 | Good 2.1% |
| Immigrants | South America | 73.8 /100 | #153 | Good 2.1% |
| Slovenes | 73.6 /100 | #154 | Good 2.1% |
| Immigrants | Colombia | 72.1 /100 | #155 | Good 2.1% |
| Pakistanis | 71.6 /100 | #156 | Good 2.1% |
| Serbians | 70.2 /100 | #157 | Good 2.1% |
| Immigrants | Uzbekistan | 69.9 /100 | #158 | Good 2.1% |
| South Africans | 69.8 /100 | #159 | Good 2.1% |
| Austrians | 69.0 /100 | #160 | Good 2.1% |
| Iraqis | 67.7 /100 | #161 | Good 2.1% |
| Hungarians | 67.4 /100 | #162 | Good 2.1% |
| Icelanders | 66.1 /100 | #163 | Good 2.1% |
Demographics Similar to Immigrants from Czechoslovakia by Vision Disability
In terms of vision disability, the demographic groups most similar to Immigrants from Czechoslovakia are Immigrants from Northern Africa (2.0%, a difference of 0.10%), Russian (2.0%, a difference of 0.17%), Immigrants from Kazakhstan (2.0%, a difference of 0.19%), Immigrants from Northern Europe (2.0%, a difference of 0.20%), and Immigrants from Argentina (2.0%, a difference of 0.21%).
| Demographics | Rating | Rank | Vision Disability |
| Immigrants | Belgium | 99.1 /100 | #61 | Exceptional 2.0% |
| Immigrants | Russia | 99.1 /100 | #62 | Exceptional 2.0% |
| Armenians | 99.0 /100 | #63 | Exceptional 2.0% |
| Immigrants | Greece | 99.0 /100 | #64 | Exceptional 2.0% |
| Maltese | 98.9 /100 | #65 | Exceptional 2.0% |
| Immigrants | Argentina | 98.9 /100 | #66 | Exceptional 2.0% |
| Immigrants | Northern Africa | 98.8 /100 | #67 | Exceptional 2.0% |
| Immigrants | Czechoslovakia | 98.7 /100 | #68 | Exceptional 2.0% |
| Russians | 98.6 /100 | #69 | Exceptional 2.0% |
| Immigrants | Kazakhstan | 98.6 /100 | #70 | Exceptional 2.0% |
| Immigrants | Northern Europe | 98.6 /100 | #71 | Exceptional 2.0% |
| Immigrants | France | 98.5 /100 | #72 | Exceptional 2.0% |
| Immigrants | Eritrea | 98.4 /100 | #73 | Exceptional 2.0% |
| Palestinians | 98.3 /100 | #74 | Exceptional 2.0% |
| Immigrants | North Macedonia | 98.3 /100 | #75 | Exceptional 2.0% |