Pakistani vs French Canadian 2 or more Vehicles in Household
COMPARE
Pakistani
French Canadian
2 or more Vehicles in Household
2 or more Vehicles in Household Comparison
Pakistanis
French Canadians
57.9%
2 OR MORE VEHICLES IN HOUSEHOLD
99.0/ 100
METRIC RATING
91st/ 347
METRIC RANK
58.9%
2 OR MORE VEHICLES IN HOUSEHOLD
99.8/ 100
METRIC RATING
60th/ 347
METRIC RANK
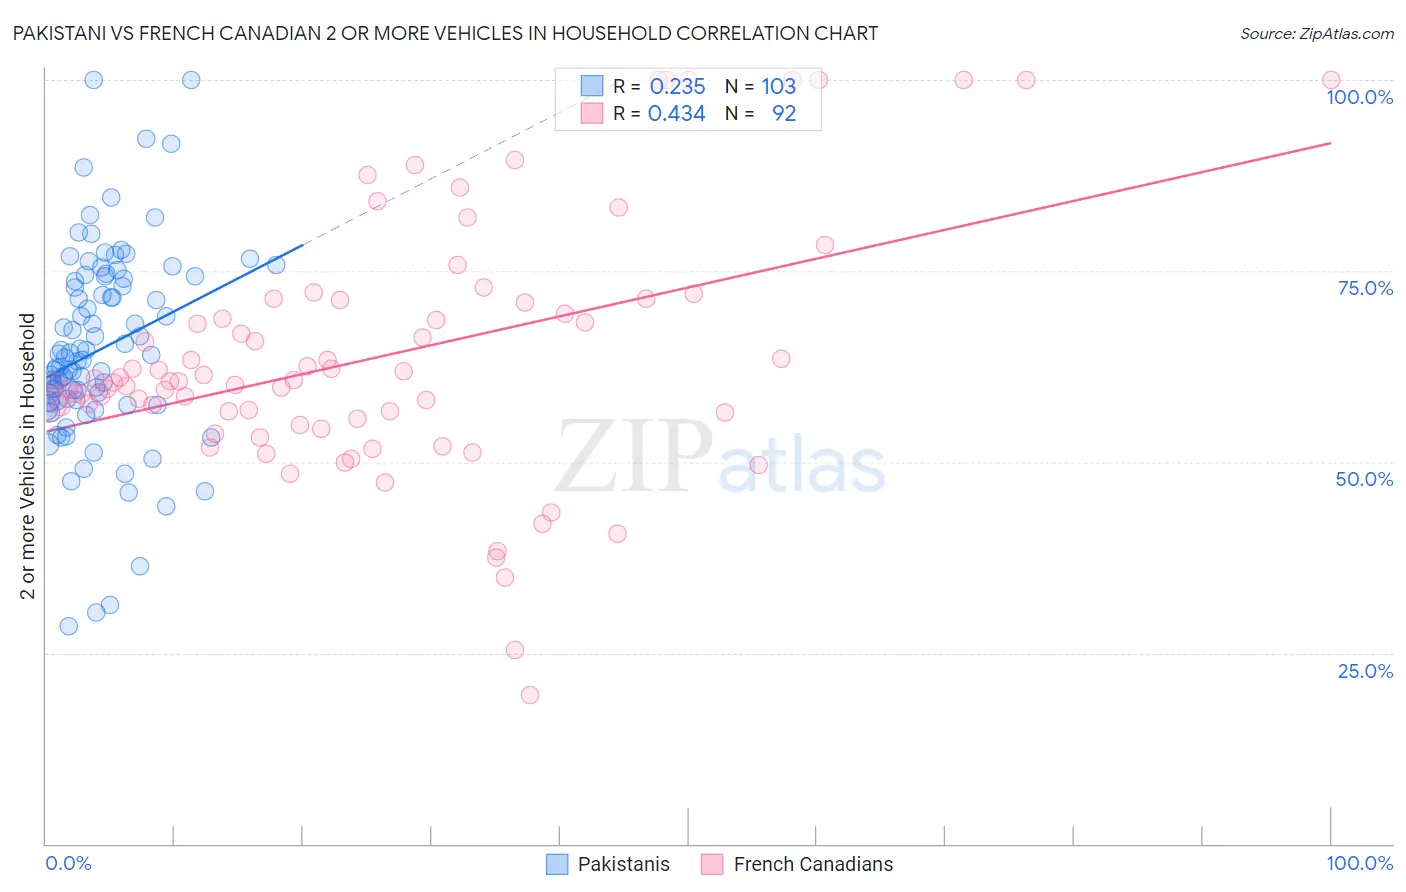
Pakistani vs French Canadian 2 or more Vehicles in Household Correlation Chart
The statistical analysis conducted on geographies consisting of 335,209,780 people shows a weak positive correlation between the proportion of Pakistanis and percentage of households with 2 or more vehicles available in the United States with a correlation coefficient (R) of 0.235 and weighted average of 57.9%. Similarly, the statistical analysis conducted on geographies consisting of 502,331,363 people shows a moderate positive correlation between the proportion of French Canadians and percentage of households with 2 or more vehicles available in the United States with a correlation coefficient (R) of 0.434 and weighted average of 58.9%, a difference of 1.7%.
2 or more Vehicles in Household Correlation Summary
| Measurement | Pakistani | French Canadian |
| Minimum | 28.5% | 19.5% |
| Maximum | 100.0% | 100.0% |
| Range | 71.5% | 80.5% |
| Mean | 64.7% | 63.9% |
| Median | 63.3% | 60.5% |
| Interquartile 25% (IQ1) | 57.9% | 56.1% |
| Interquartile 75% (IQ3) | 74.1% | 71.1% |
| Interquartile Range (IQR) | 16.1% | 15.0% |
| Standard Deviation (Sample) | 12.9% | 16.6% |
| Standard Deviation (Population) | 12.9% | 16.5% |
Similar Demographics by 2 or more Vehicles in Household
Demographics Similar to Pakistanis by 2 or more Vehicles in Household
In terms of 2 or more vehicles in household, the demographic groups most similar to Pakistanis are Shoshone (57.9%, a difference of 0.020%), Immigrants from Germany (57.9%, a difference of 0.030%), Hispanic or Latino (57.9%, a difference of 0.030%), Ottawa (57.9%, a difference of 0.030%), and Immigrants from Iran (57.9%, a difference of 0.090%).
| Demographics | Rating | Rank | 2 or more Vehicles in Household |
| Maltese | 99.2 /100 | #84 | Exceptional 58.0% |
| Slovaks | 99.2 /100 | #85 | Exceptional 58.0% |
| Potawatomi | 99.1 /100 | #86 | Exceptional 58.0% |
| Thais | 99.1 /100 | #87 | Exceptional 57.9% |
| Immigrants | Iran | 99.1 /100 | #88 | Exceptional 57.9% |
| Immigrants | Germany | 99.0 /100 | #89 | Exceptional 57.9% |
| Hispanics or Latinos | 99.0 /100 | #90 | Exceptional 57.9% |
| Pakistanis | 99.0 /100 | #91 | Exceptional 57.9% |
| Shoshone | 99.0 /100 | #92 | Exceptional 57.9% |
| Ottawa | 99.0 /100 | #93 | Exceptional 57.9% |
| Filipinos | 98.9 /100 | #94 | Exceptional 57.8% |
| Hmong | 98.9 /100 | #95 | Exceptional 57.8% |
| Burmese | 98.8 /100 | #96 | Exceptional 57.8% |
| Slavs | 98.8 /100 | #97 | Exceptional 57.8% |
| Palestinians | 98.6 /100 | #98 | Exceptional 57.7% |
Demographics Similar to French Canadians by 2 or more Vehicles in Household
In terms of 2 or more vehicles in household, the demographic groups most similar to French Canadians are Spanish American (58.9%, a difference of 0.030%), Immigrants from Scotland (58.9%, a difference of 0.050%), Osage (58.8%, a difference of 0.13%), Nonimmigrants (58.8%, a difference of 0.17%), and Afghan (59.0%, a difference of 0.23%).
| Demographics | Rating | Rank | 2 or more Vehicles in Household |
| Celtics | 99.9 /100 | #53 | Exceptional 59.2% |
| Bhutanese | 99.9 /100 | #54 | Exceptional 59.1% |
| Luxembourgers | 99.9 /100 | #55 | Exceptional 59.1% |
| Chickasaw | 99.9 /100 | #56 | Exceptional 59.0% |
| Afghans | 99.9 /100 | #57 | Exceptional 59.0% |
| Immigrants | Scotland | 99.8 /100 | #58 | Exceptional 58.9% |
| Spanish Americans | 99.8 /100 | #59 | Exceptional 58.9% |
| French Canadians | 99.8 /100 | #60 | Exceptional 58.9% |
| Osage | 99.8 /100 | #61 | Exceptional 58.8% |
| Immigrants | Nonimmigrants | 99.8 /100 | #62 | Exceptional 58.8% |
| Mexican American Indians | 99.8 /100 | #63 | Exceptional 58.7% |
| Portuguese | 99.7 /100 | #64 | Exceptional 58.6% |
| Immigrants | Central America | 99.7 /100 | #65 | Exceptional 58.6% |
| Croatians | 99.7 /100 | #66 | Exceptional 58.6% |
| Laotians | 99.7 /100 | #67 | Exceptional 58.6% |