Slavic vs Russian 2 or more Vehicles in Household
COMPARE
Slavic
Russian
2 or more Vehicles in Household
2 or more Vehicles in Household Comparison
Slavs
Russians
57.8%
2 OR MORE VEHICLES IN HOUSEHOLD
98.8/ 100
METRIC RATING
97th/ 347
METRIC RANK
54.8%
2 OR MORE VEHICLES IN HOUSEHOLD
26.3/ 100
METRIC RATING
190th/ 347
METRIC RANK
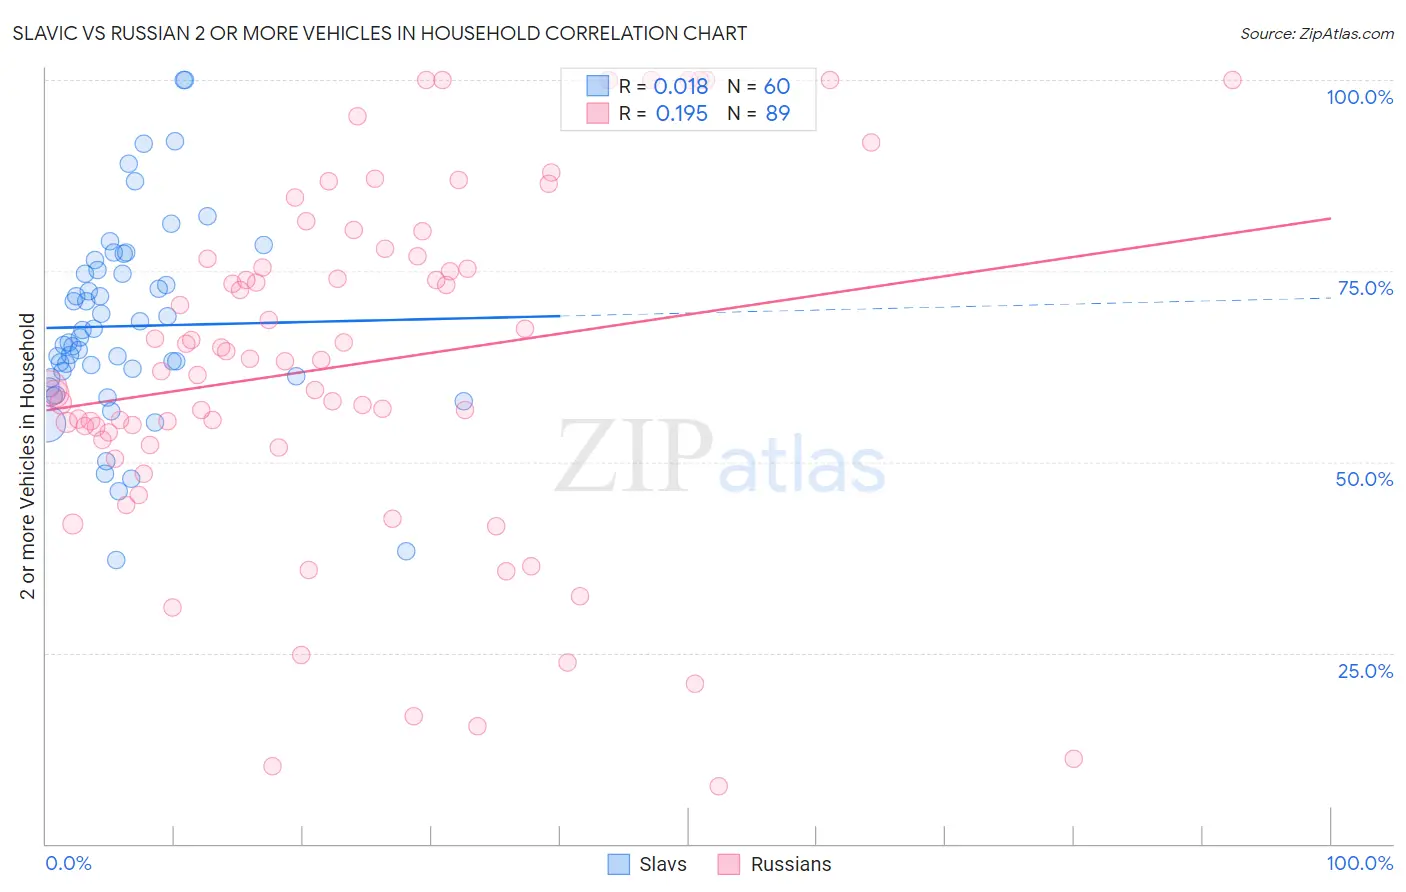
Slavic vs Russian 2 or more Vehicles in Household Correlation Chart
The statistical analysis conducted on geographies consisting of 270,821,936 people shows no correlation between the proportion of Slavs and percentage of households with 2 or more vehicles available in the United States with a correlation coefficient (R) of 0.018 and weighted average of 57.8%. Similarly, the statistical analysis conducted on geographies consisting of 511,789,622 people shows a poor positive correlation between the proportion of Russians and percentage of households with 2 or more vehicles available in the United States with a correlation coefficient (R) of 0.195 and weighted average of 54.8%, a difference of 5.5%.
2 or more Vehicles in Household Correlation Summary
| Measurement | Slavic | Russian |
| Minimum | 37.2% | 7.6% |
| Maximum | 100.0% | 100.0% |
| Range | 62.8% | 92.4% |
| Mean | 67.8% | 62.7% |
| Median | 66.0% | 63.1% |
| Interquartile 25% (IQ1) | 61.1% | 52.5% |
| Interquartile 75% (IQ3) | 74.9% | 76.7% |
| Interquartile Range (IQR) | 13.7% | 24.2% |
| Standard Deviation (Sample) | 12.9% | 22.8% |
| Standard Deviation (Population) | 12.8% | 22.7% |
Similar Demographics by 2 or more Vehicles in Household
Demographics Similar to Slavs by 2 or more Vehicles in Household
In terms of 2 or more vehicles in household, the demographic groups most similar to Slavs are Burmese (57.8%, a difference of 0.020%), Hmong (57.8%, a difference of 0.060%), Filipino (57.8%, a difference of 0.080%), Ottawa (57.9%, a difference of 0.14%), and Shoshone (57.9%, a difference of 0.15%).
| Demographics | Rating | Rank | 2 or more Vehicles in Household |
| Hispanics or Latinos | 99.0 /100 | #90 | Exceptional 57.9% |
| Pakistanis | 99.0 /100 | #91 | Exceptional 57.9% |
| Shoshone | 99.0 /100 | #92 | Exceptional 57.9% |
| Ottawa | 99.0 /100 | #93 | Exceptional 57.9% |
| Filipinos | 98.9 /100 | #94 | Exceptional 57.8% |
| Hmong | 98.9 /100 | #95 | Exceptional 57.8% |
| Burmese | 98.8 /100 | #96 | Exceptional 57.8% |
| Slavs | 98.8 /100 | #97 | Exceptional 57.8% |
| Palestinians | 98.6 /100 | #98 | Exceptional 57.7% |
| Cajuns | 98.5 /100 | #99 | Exceptional 57.7% |
| Fijians | 98.4 /100 | #100 | Exceptional 57.6% |
| Lebanese | 98.3 /100 | #101 | Exceptional 57.6% |
| Immigrants | Bolivia | 98.2 /100 | #102 | Exceptional 57.6% |
| Jordanians | 98.2 /100 | #103 | Exceptional 57.6% |
| Immigrants | Indonesia | 98.2 /100 | #104 | Exceptional 57.6% |
Demographics Similar to Russians by 2 or more Vehicles in Household
In terms of 2 or more vehicles in household, the demographic groups most similar to Russians are Eastern European (54.8%, a difference of 0.060%), Immigrants (54.7%, a difference of 0.070%), Immigrants from Romania (54.7%, a difference of 0.13%), Immigrants from Japan (54.7%, a difference of 0.16%), and Central American (54.7%, a difference of 0.18%).
| Demographics | Rating | Rank | 2 or more Vehicles in Household |
| Immigrants | Cameroon | 37.3 /100 | #183 | Fair 55.1% |
| Apache | 36.7 /100 | #184 | Fair 55.1% |
| Arabs | 35.9 /100 | #185 | Fair 55.0% |
| Peruvians | 33.7 /100 | #186 | Fair 55.0% |
| Immigrants | Uganda | 33.4 /100 | #187 | Fair 55.0% |
| Marshallese | 30.5 /100 | #188 | Fair 54.9% |
| Eastern Europeans | 27.5 /100 | #189 | Fair 54.8% |
| Russians | 26.3 /100 | #190 | Fair 54.8% |
| Immigrants | Immigrants | 25.0 /100 | #191 | Fair 54.7% |
| Immigrants | Romania | 23.8 /100 | #192 | Fair 54.7% |
| Immigrants | Japan | 23.4 /100 | #193 | Fair 54.7% |
| Central Americans | 23.0 /100 | #194 | Fair 54.7% |
| Iroquois | 22.6 /100 | #195 | Fair 54.7% |
| Immigrants | Poland | 19.3 /100 | #196 | Poor 54.6% |
| Argentineans | 17.5 /100 | #197 | Poor 54.5% |