Immigrants from Africa vs Finnish 2 or more Vehicles in Household
COMPARE
Immigrants from Africa
Finnish
2 or more Vehicles in Household
2 or more Vehicles in Household Comparison
Immigrants from Africa
Finns
51.8%
2 OR MORE VEHICLES IN HOUSEHOLD
0.2/ 100
METRIC RATING
277th/ 347
METRIC RANK
60.3%
2 OR MORE VEHICLES IN HOUSEHOLD
100.0/ 100
METRIC RATING
30th/ 347
METRIC RANK
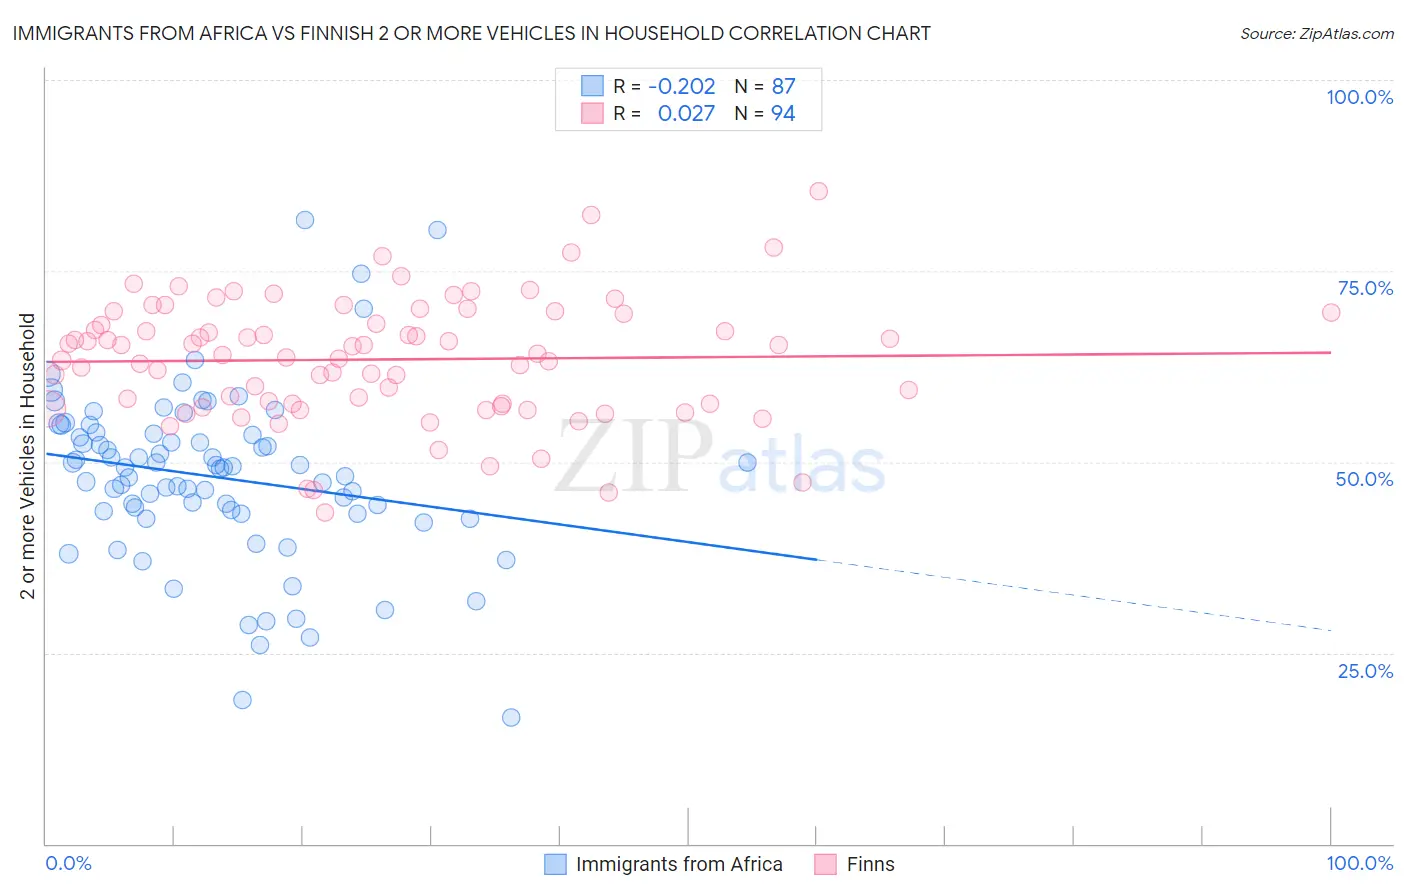
Immigrants from Africa vs Finnish 2 or more Vehicles in Household Correlation Chart
The statistical analysis conducted on geographies consisting of 468,994,559 people shows a weak negative correlation between the proportion of Immigrants from Africa and percentage of households with 2 or more vehicles available in the United States with a correlation coefficient (R) of -0.202 and weighted average of 51.8%. Similarly, the statistical analysis conducted on geographies consisting of 404,547,862 people shows no correlation between the proportion of Finns and percentage of households with 2 or more vehicles available in the United States with a correlation coefficient (R) of 0.027 and weighted average of 60.3%, a difference of 16.5%.
2 or more Vehicles in Household Correlation Summary
| Measurement | Immigrants from Africa | Finnish |
| Minimum | 16.4% | 43.4% |
| Maximum | 81.7% | 85.5% |
| Range | 65.2% | 42.1% |
| Mean | 48.0% | 63.4% |
| Median | 49.2% | 64.1% |
| Interquartile 25% (IQ1) | 43.2% | 57.6% |
| Interquartile 75% (IQ3) | 53.7% | 69.4% |
| Interquartile Range (IQR) | 10.5% | 11.8% |
| Standard Deviation (Sample) | 11.3% | 8.0% |
| Standard Deviation (Population) | 11.2% | 8.0% |
Similar Demographics by 2 or more Vehicles in Household
Demographics Similar to Immigrants from Africa by 2 or more Vehicles in Household
In terms of 2 or more vehicles in household, the demographic groups most similar to Immigrants from Africa are Immigrants from Croatia (51.8%, a difference of 0.050%), Yuman (51.7%, a difference of 0.060%), Liberian (51.7%, a difference of 0.070%), Immigrants from Honduras (51.8%, a difference of 0.080%), and African (51.8%, a difference of 0.090%).
| Demographics | Rating | Rank | 2 or more Vehicles in Household |
| Immigrants | Ireland | 0.2 /100 | #270 | Tragic 52.0% |
| South Americans | 0.2 /100 | #271 | Tragic 51.9% |
| Sub-Saharan Africans | 0.2 /100 | #272 | Tragic 51.9% |
| Israelis | 0.2 /100 | #273 | Tragic 51.9% |
| Africans | 0.2 /100 | #274 | Tragic 51.8% |
| Immigrants | Honduras | 0.2 /100 | #275 | Tragic 51.8% |
| Immigrants | Croatia | 0.2 /100 | #276 | Tragic 51.8% |
| Immigrants | Africa | 0.2 /100 | #277 | Tragic 51.8% |
| Yuman | 0.1 /100 | #278 | Tragic 51.7% |
| Liberians | 0.1 /100 | #279 | Tragic 51.7% |
| Immigrants | Eastern Europe | 0.1 /100 | #280 | Tragic 51.7% |
| Immigrants | Kazakhstan | 0.1 /100 | #281 | Tragic 51.6% |
| Bahamians | 0.1 /100 | #282 | Tragic 51.5% |
| Immigrants | China | 0.1 /100 | #283 | Tragic 51.5% |
| Immigrants | Zaire | 0.1 /100 | #284 | Tragic 51.5% |
Demographics Similar to Finns by 2 or more Vehicles in Household
In terms of 2 or more vehicles in household, the demographic groups most similar to Finns are Spanish American Indian (60.3%, a difference of 0.030%), Hawaiian (60.4%, a difference of 0.13%), Arapaho (60.2%, a difference of 0.13%), Immigrants from Mexico (60.2%, a difference of 0.19%), and Guamanian/Chamorro (60.5%, a difference of 0.24%).
| Demographics | Rating | Rank | 2 or more Vehicles in Household |
| Scotch-Irish | 100.0 /100 | #23 | Exceptional 60.9% |
| Immigrants | Vietnam | 100.0 /100 | #24 | Exceptional 60.9% |
| Whites/Caucasians | 100.0 /100 | #25 | Exceptional 60.8% |
| Welsh | 100.0 /100 | #26 | Exceptional 60.8% |
| Assyrians/Chaldeans/Syriacs | 100.0 /100 | #27 | Exceptional 60.5% |
| Guamanians/Chamorros | 100.0 /100 | #28 | Exceptional 60.5% |
| Hawaiians | 100.0 /100 | #29 | Exceptional 60.4% |
| Finns | 100.0 /100 | #30 | Exceptional 60.3% |
| Spanish American Indians | 100.0 /100 | #31 | Exceptional 60.3% |
| Arapaho | 100.0 /100 | #32 | Exceptional 60.2% |
| Immigrants | Mexico | 100.0 /100 | #33 | Exceptional 60.2% |
| Spanish | 100.0 /100 | #34 | Exceptional 60.2% |
| Immigrants | Philippines | 100.0 /100 | #35 | Exceptional 60.1% |
| Chinese | 100.0 /100 | #36 | Exceptional 60.1% |
| Irish | 100.0 /100 | #37 | Exceptional 60.1% |