Paiute vs Finnish Child Poverty Among Girls Under 16
COMPARE
Paiute
Finnish
Child Poverty Among Girls Under 16
Child Poverty Among Girls Under 16 Comparison
Paiute
Finns
22.6%
CHILD POVERTY AMONG GIRLS UNDER 16
0.0/ 100
METRIC RATING
324th/ 347
METRIC RANK
14.8%
CHILD POVERTY AMONG GIRLS UNDER 16
97.2/ 100
METRIC RATING
87th/ 347
METRIC RANK
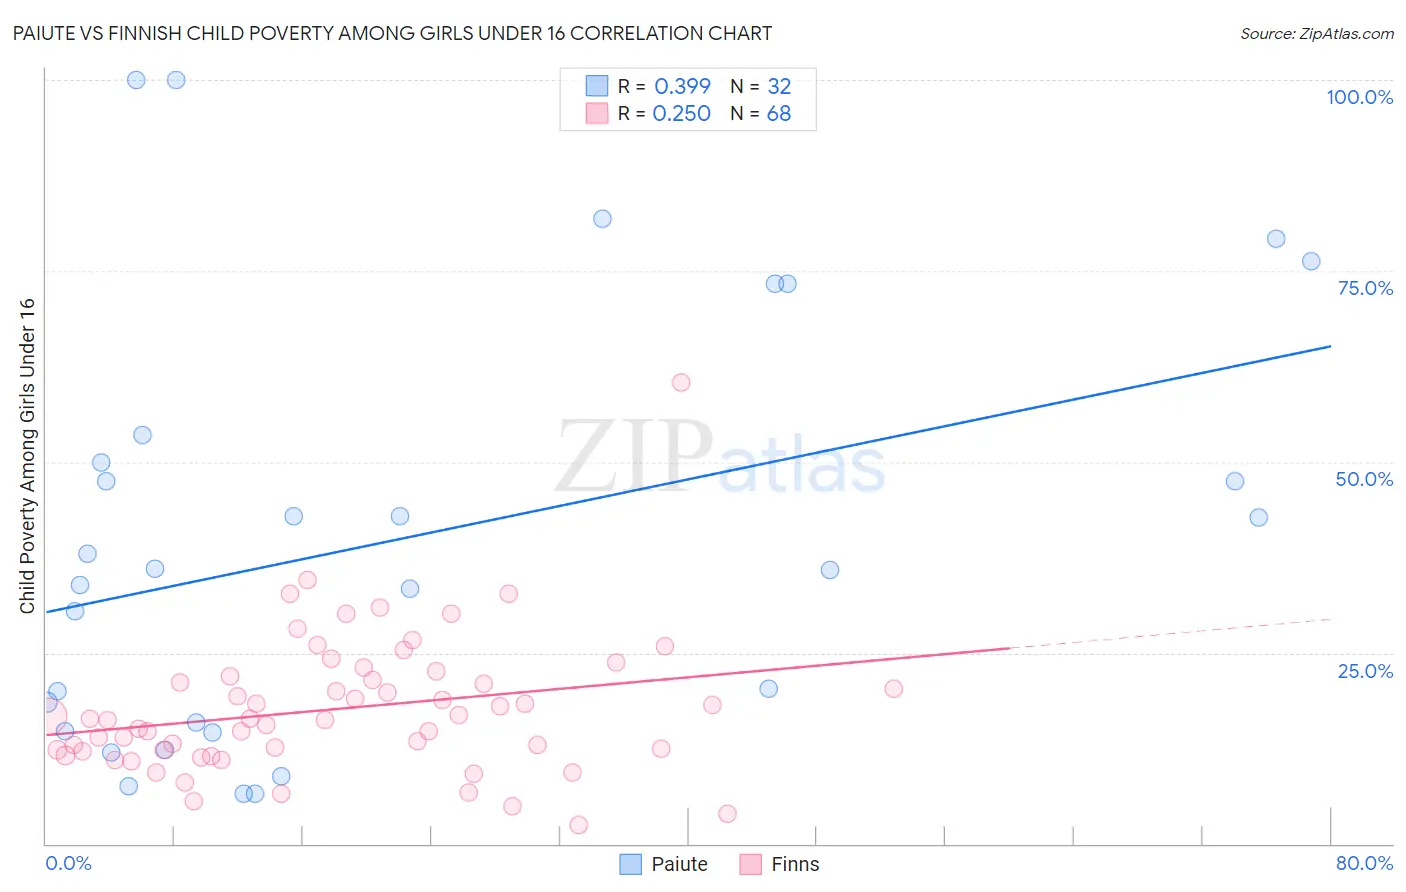
Paiute vs Finnish Child Poverty Among Girls Under 16 Correlation Chart
The statistical analysis conducted on geographies consisting of 58,132,859 people shows a mild positive correlation between the proportion of Paiute and poverty level among girls under the age of 16 in the United States with a correlation coefficient (R) of 0.399 and weighted average of 22.6%. Similarly, the statistical analysis conducted on geographies consisting of 395,065,953 people shows a weak positive correlation between the proportion of Finns and poverty level among girls under the age of 16 in the United States with a correlation coefficient (R) of 0.250 and weighted average of 14.8%, a difference of 53.0%.
Child Poverty Among Girls Under 16 Correlation Summary
| Measurement | Paiute | Finnish |
| Minimum | 6.5% | 2.4% |
| Maximum | 100.0% | 60.3% |
| Range | 93.5% | 57.9% |
| Mean | 39.9% | 17.7% |
| Median | 35.9% | 16.3% |
| Interquartile 25% (IQ1) | 15.3% | 12.2% |
| Interquartile 75% (IQ3) | 51.8% | 21.7% |
| Interquartile Range (IQR) | 36.5% | 9.5% |
| Standard Deviation (Sample) | 27.6% | 9.0% |
| Standard Deviation (Population) | 27.1% | 9.0% |
Similar Demographics by Child Poverty Among Girls Under 16
Demographics Similar to Paiute by Child Poverty Among Girls Under 16
In terms of child poverty among girls under 16, the demographic groups most similar to Paiute are Cajun (22.6%, a difference of 0.29%), Yakama (22.6%, a difference of 0.31%), Colville (22.5%, a difference of 0.50%), Immigrants from Congo (22.7%, a difference of 0.50%), and Immigrants from Honduras (22.8%, a difference of 0.63%).
| Demographics | Rating | Rank | Child Poverty Among Girls Under 16 |
| Africans | 0.0 /100 | #317 | Tragic 21.9% |
| Immigrants | Dominica | 0.0 /100 | #318 | Tragic 22.1% |
| U.S. Virgin Islanders | 0.0 /100 | #319 | Tragic 22.1% |
| Hondurans | 0.0 /100 | #320 | Tragic 22.2% |
| Colville | 0.0 /100 | #321 | Tragic 22.5% |
| Yakama | 0.0 /100 | #322 | Tragic 22.6% |
| Cajuns | 0.0 /100 | #323 | Tragic 22.6% |
| Paiute | 0.0 /100 | #324 | Tragic 22.6% |
| Immigrants | Congo | 0.0 /100 | #325 | Tragic 22.7% |
| Immigrants | Honduras | 0.0 /100 | #326 | Tragic 22.8% |
| Central American Indians | 0.0 /100 | #327 | Tragic 22.8% |
| Dominicans | 0.0 /100 | #328 | Tragic 23.7% |
| Kiowa | 0.0 /100 | #329 | Tragic 23.7% |
| Immigrants | Dominican Republic | 0.0 /100 | #330 | Tragic 23.8% |
| Apache | 0.0 /100 | #331 | Tragic 23.8% |
Demographics Similar to Finns by Child Poverty Among Girls Under 16
In terms of child poverty among girls under 16, the demographic groups most similar to Finns are Australian (14.8%, a difference of 0.020%), Swiss (14.8%, a difference of 0.060%), Immigrants from Canada (14.8%, a difference of 0.070%), Jordanian (14.8%, a difference of 0.12%), and Northern European (14.8%, a difference of 0.14%).
| Demographics | Rating | Rank | Child Poverty Among Girls Under 16 |
| Egyptians | 97.9 /100 | #80 | Exceptional 14.7% |
| Ukrainians | 97.7 /100 | #81 | Exceptional 14.7% |
| Macedonians | 97.6 /100 | #82 | Exceptional 14.7% |
| Immigrants | Italy | 97.4 /100 | #83 | Exceptional 14.8% |
| Soviet Union | 97.3 /100 | #84 | Exceptional 14.8% |
| Swiss | 97.2 /100 | #85 | Exceptional 14.8% |
| Australians | 97.2 /100 | #86 | Exceptional 14.8% |
| Finns | 97.2 /100 | #87 | Exceptional 14.8% |
| Immigrants | Canada | 97.1 /100 | #88 | Exceptional 14.8% |
| Jordanians | 97.1 /100 | #89 | Exceptional 14.8% |
| Northern Europeans | 97.0 /100 | #90 | Exceptional 14.8% |
| Immigrants | Belarus | 97.0 /100 | #91 | Exceptional 14.8% |
| Austrians | 96.7 /100 | #92 | Exceptional 14.9% |
| Immigrants | North America | 96.6 /100 | #93 | Exceptional 14.9% |
| Immigrants | Switzerland | 96.3 /100 | #94 | Exceptional 14.9% |