Nonimmigrants vs Potawatomi 7th Grade
COMPARE
Nonimmigrants
Potawatomi
7th Grade
7th Grade Comparison
Nonimmigrants
Potawatomi
96.5%
7TH GRADE
97.0/ 100
METRIC RATING
112th/ 347
METRIC RANK
96.7%
7TH GRADE
98.9/ 100
METRIC RATING
93rd/ 347
METRIC RANK
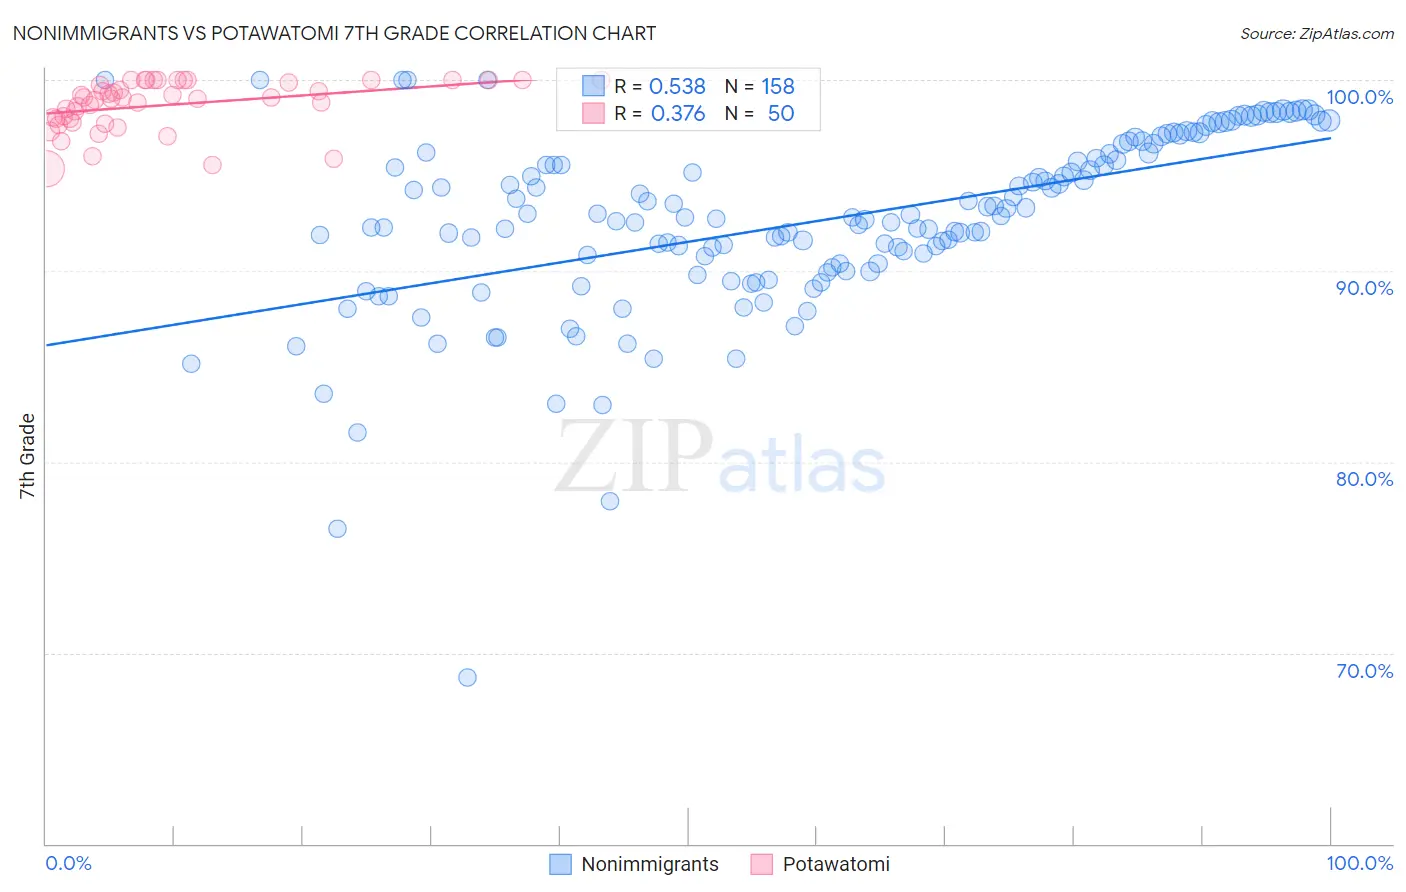
Nonimmigrants vs Potawatomi 7th Grade Correlation Chart
The statistical analysis conducted on geographies consisting of 585,374,406 people shows a substantial positive correlation between the proportion of Nonimmigrants and percentage of population with at least 7th grade education in the United States with a correlation coefficient (R) of 0.538 and weighted average of 96.5%. Similarly, the statistical analysis conducted on geographies consisting of 117,769,196 people shows a mild positive correlation between the proportion of Potawatomi and percentage of population with at least 7th grade education in the United States with a correlation coefficient (R) of 0.376 and weighted average of 96.7%, a difference of 0.16%.
7th Grade Correlation Summary
| Measurement | Nonimmigrants | Potawatomi |
| Minimum | 68.7% | 95.4% |
| Maximum | 100.0% | 100.0% |
| Range | 31.3% | 4.6% |
| Mean | 92.6% | 98.7% |
| Median | 92.8% | 99.0% |
| Interquartile 25% (IQ1) | 90.2% | 98.0% |
| Interquartile 75% (IQ3) | 96.1% | 100.0% |
| Interquartile Range (IQR) | 5.9% | 2.0% |
| Standard Deviation (Sample) | 4.7% | 1.3% |
| Standard Deviation (Population) | 4.7% | 1.3% |
Demographics Similar to Nonimmigrants and Potawatomi by 7th Grade
In terms of 7th grade, the demographic groups most similar to Nonimmigrants are Okinawan (96.6%, a difference of 0.020%), Immigrants from Latvia (96.6%, a difference of 0.020%), Bhutanese (96.6%, a difference of 0.040%), Lumbee (96.6%, a difference of 0.050%), and Immigrants from Saudi Arabia (96.6%, a difference of 0.050%). Similarly, the demographic groups most similar to Potawatomi are Immigrants from Western Europe (96.7%, a difference of 0.0%), Lebanese (96.7%, a difference of 0.010%), Immigrants from Australia (96.7%, a difference of 0.010%), Immigrants from Denmark (96.7%, a difference of 0.030%), and Immigrants from Germany (96.7%, a difference of 0.030%).
| Demographics | Rating | Rank | 7th Grade |
| Immigrants | Western Europe | 98.9 /100 | #92 | Exceptional 96.7% |
| Potawatomi | 98.9 /100 | #93 | Exceptional 96.7% |
| Lebanese | 98.8 /100 | #94 | Exceptional 96.7% |
| Immigrants | Australia | 98.8 /100 | #95 | Exceptional 96.7% |
| Immigrants | Denmark | 98.7 /100 | #96 | Exceptional 96.7% |
| Immigrants | Germany | 98.7 /100 | #97 | Exceptional 96.7% |
| Immigrants | Sweden | 98.7 /100 | #98 | Exceptional 96.7% |
| Menominee | 98.7 /100 | #99 | Exceptional 96.7% |
| German Russians | 98.6 /100 | #100 | Exceptional 96.7% |
| Thais | 98.6 /100 | #101 | Exceptional 96.7% |
| Immigrants | Czechoslovakia | 98.3 /100 | #102 | Exceptional 96.6% |
| Immigrants | Singapore | 98.3 /100 | #103 | Exceptional 96.6% |
| Shoshone | 98.1 /100 | #104 | Exceptional 96.6% |
| South Africans | 98.0 /100 | #105 | Exceptional 96.6% |
| Iroquois | 97.9 /100 | #106 | Exceptional 96.6% |
| Lumbee | 97.8 /100 | #107 | Exceptional 96.6% |
| Immigrants | Saudi Arabia | 97.8 /100 | #108 | Exceptional 96.6% |
| Bhutanese | 97.7 /100 | #109 | Exceptional 96.6% |
| Okinawans | 97.4 /100 | #110 | Exceptional 96.6% |
| Immigrants | Latvia | 97.4 /100 | #111 | Exceptional 96.6% |
| Immigrants | Nonimmigrants | 97.0 /100 | #112 | Exceptional 96.5% |