Nonimmigrants vs Immigrants from Panama Kindergarten

COMPARE

Nonimmigrants
Race
Ancestry
AfghanAfricanAlaska NativeAlaskan AthabascanAlbanianAleutAlsatianAmericanApacheArabArapahoArgentineanArmenianAssyrian/Chaldean/SyriacAustralianAustrianBahamianBangladeshiBarbadianBasqueBelgianBelizeanBermudanBhutaneseBlackfeetBolivianBrazilianBritishBritish West IndianBulgarianBurmeseCajunCambodianCanadianCape VerdeanCarpatho RusynCelticCentral AmericanCentral American IndianCherokeeCheyenneChickasawChileanChineseChippewaChoctawColombianColvilleComancheCosta RicanCreeCreekCroatianCrowCubanCypriotCzechCzechoslovakianDanishDelawareDominicanDutchDutch West IndianEastern EuropeanEcuadorianEgyptianEnglishEstonianEthiopianEuropeanFijianFilipinoFinnishFrenchFrench American IndianFrench CanadianGermanGerman RussianGhanaianGreekGuamanian/ChamorroGuatemalanGuyaneseHaitianHmongHonduranHopiHoumaHungarianIcelanderIndian (Asian)IndonesianInupiatIranianIraqiIrishIroquoisIsraeliItalianJamaicanJapaneseJordanianKenyanKiowaKoreanLaotianLatvianLebaneseLiberianLithuanianLumbeeLuxembourgerMacedonianMalaysianMalteseMarshalleseMenomineeMexicanMexican American IndianMongolianMoroccanNative HawaiianNavajoNepaleseNew ZealanderNicaraguanNigerianNorthern EuropeanNorwegianOkinawanOsageOttawaPaiutePakistaniPalestinianPanamanianParaguayanPennsylvania GermanPeruvianPimaPolishPortuguesePotawatomiPuebloPuerto RicanPuget Sound SalishRomanianRussianSalvadoranSamoanScandinavianScotch-IrishScottishSeminoleSenegaleseSerbianShoshoneSierra LeoneanSiouxSlavicSlovakSloveneSomaliSouth AfricanSouth AmericanSouth American IndianSoviet UnionSpaniardSpanishSpanish AmericanSpanish American IndianSri LankanSubsaharan AfricanSudaneseSwedishSwissSyrianTaiwaneseThaiTlingit-HaidaTohono O'OdhamTonganTrinidadian and TobagonianTsimshianTurkishU.S. Virgin IslanderUgandanUkrainianUruguayanUteVenezuelanVietnameseWelshWest IndianYakamaYaquiYugoslavianYumanYup'ikZimbabwean
Immigration
NonimmigrantsImmigrantsAfghanistanAfricaAlbaniaArgentinaArmeniaAsiaAustraliaAustriaBahamasBangladeshBarbadosBelarusBelgiumBelizeBoliviaBosnia and HerzegovinaBrazilBulgariaBurma/MyanmarCabo VerdeCambodiaCameroonCanadaCaribbeanCentral AmericaChileChinaColombiaCongoCosta RicaCroatiaCubaCzechoslovakiaDenmarkDominicaDominican RepublicEastern AfricaEastern AsiaEastern EuropeEcuadorEgyptEl SalvadorEnglandEritreaEthiopiaEuropeFijiFranceGermanyGhanaGreeceGrenadaGuatemalaGuyanaHaitiHondurasHong KongHungaryIndiaIndonesiaIranIraqIrelandIsraelItalyJamaicaJapanJordanKazakhstanKenyaKoreaKuwaitLaosLatin AmericaLatviaLebanonLiberiaLithuaniaMalaysiaMexicoMicronesiaMiddle AfricaMoldovaMoroccoNepalNetherlandsNicaraguaNigeriaNorth AmericaNorth MacedoniaNorthern AfricaNorthern EuropeNorwayOceaniaPakistanPeruPhilippinesPolandPortugalRomaniaRussiaSaudi ArabiaScotlandSenegalSerbiaSierra LeoneSingaporeSomaliaSouth AfricaSouth AmericaSouth Central AsiaSouth Eastern AsiaSouthern EuropeSpainSri LankaSt. Vincent and the GrenadinesSudanSwedenSwitzerlandSyriaTaiwanThailandTrinidad and TobagoTurkeyUgandaUkraineUruguayUzbekistanVenezuelaVietnamWest IndiesWestern AfricaWestern AsiaWestern EuropeYemenZaireZimbabweAzores
Immigrants from Panama
Race
Ancestry
AfghanAfricanAlaska NativeAlaskan AthabascanAlbanianAleutAlsatianAmericanApacheArabArapahoArgentineanArmenianAssyrian/Chaldean/SyriacAustralianAustrianBahamianBangladeshiBarbadianBasqueBelgianBelizeanBermudanBhutaneseBlackfeetBolivianBrazilianBritishBritish West IndianBulgarianBurmeseCajunCambodianCanadianCape VerdeanCarpatho RusynCelticCentral AmericanCentral American IndianCherokeeCheyenneChickasawChileanChineseChippewaChoctawColombianColvilleComancheCosta RicanCreeCreekCroatianCrowCubanCypriotCzechCzechoslovakianDanishDelawareDominicanDutchDutch West IndianEastern EuropeanEcuadorianEgyptianEnglishEstonianEthiopianEuropeanFijianFilipinoFinnishFrenchFrench American IndianFrench CanadianGermanGerman RussianGhanaianGreekGuamanian/ChamorroGuatemalanGuyaneseHaitianHmongHonduranHopiHoumaHungarianIcelanderIndian (Asian)IndonesianInupiatIranianIraqiIrishIroquoisIsraeliItalianJamaicanJapaneseJordanianKenyanKiowaKoreanLaotianLatvianLebaneseLiberianLithuanianLumbeeLuxembourgerMacedonianMalaysianMalteseMarshalleseMenomineeMexicanMexican American IndianMongolianMoroccanNative HawaiianNavajoNepaleseNew ZealanderNicaraguanNigerianNorthern EuropeanNorwegianOkinawanOsageOttawaPaiutePakistaniPalestinianPanamanianParaguayanPennsylvania GermanPeruvianPimaPolishPortuguesePotawatomiPuebloPuerto RicanPuget Sound SalishRomanianRussianSalvadoranSamoanScandinavianScotch-IrishScottishSeminoleSenegaleseSerbianShoshoneSierra LeoneanSiouxSlavicSlovakSloveneSomaliSouth AfricanSouth AmericanSouth American IndianSoviet UnionSpaniardSpanishSpanish AmericanSpanish American IndianSri LankanSubsaharan AfricanSudaneseSwedishSwissSyrianTaiwaneseThaiTlingit-HaidaTohono O'OdhamTonganTrinidadian and TobagonianTsimshianTurkishU.S. Virgin IslanderUgandanUkrainianUruguayanUteVenezuelanVietnameseWelshWest IndianYakamaYaquiYugoslavianYumanYup'ikZimbabwean
Immigration
ImmigrantsAfghanistanAfricaAlbaniaArgentinaArmeniaAsiaAustraliaAustriaBahamasBangladeshBarbadosBelarusBelgiumBelizeBoliviaBosnia and HerzegovinaBrazilBulgariaBurma/MyanmarCabo VerdeCambodiaCameroonCanadaCaribbeanCentral AmericaChileChinaColombiaCongoCosta RicaCroatiaCubaCzechoslovakiaDenmarkDominicaDominican RepublicEastern AfricaEastern AsiaEastern EuropeEcuadorEgyptEl SalvadorEnglandEritreaEthiopiaEuropeFijiFranceGermanyGhanaGreeceGrenadaGuatemalaGuyanaHaitiHondurasHong KongHungaryIndiaIndonesiaIranIraqIrelandIsraelItalyJamaicaJapanJordanKazakhstanKenyaKoreaKuwaitLaosLatin AmericaLatviaLebanonLiberiaLithuaniaMalaysiaMexicoMicronesiaMiddle AfricaMoldovaMoroccoNepalNetherlandsNicaraguaNigeriaNorth AmericaNorth MacedoniaNorthern AfricaNorthern EuropeNorwayOceaniaPakistanPanamaPeruPhilippinesPolandPortugalRomaniaRussiaSaudi ArabiaScotlandSenegalSerbiaSierra LeoneSingaporeSomaliaSouth AfricaSouth AmericaSouth Central AsiaSouth Eastern AsiaSouthern EuropeSpainSri LankaSt. Vincent and the GrenadinesSudanSwedenSwitzerlandSyriaTaiwanThailandTrinidad and TobagoTurkeyUgandaUkraineUruguayUzbekistanVenezuelaVietnamWest IndiesWestern AfricaWestern AsiaWestern EuropeYemenZaireZimbabweAzores
Kindergarten
Income
Poverty
Unemployment
Labor Participation
Family Structure
Vehicle Availability
Education Level
Disability

Kindergarten Comparison

Nonimmigrants

Immigrants from Panama

Exceptional
Tragic
98.3%
KINDERGARTEN
98.3/ 100
METRIC RATING
96th/ 347
METRIC RANK
97.7%
KINDERGARTEN
5.0/ 100
METRIC RATING
219th/ 347
METRIC RANK

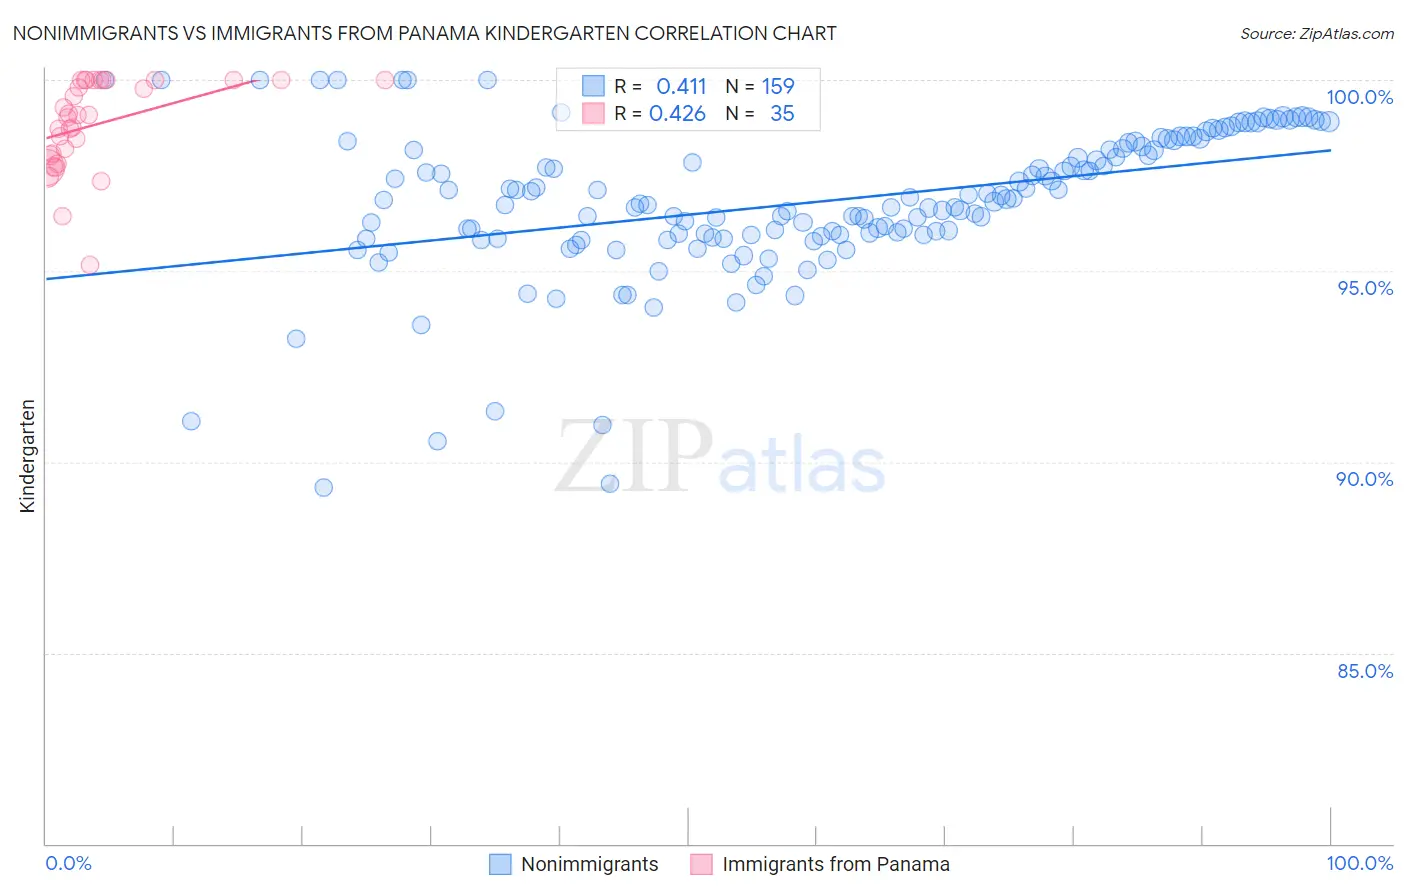
Nonimmigrants vs Immigrants from Panama Kindergarten Correlation Chart

The statistical analysis conducted on geographies consisting of 585,374,774 people shows a moderate positive correlation between the proportion of Nonimmigrants and percentage of population with at least kindergarten education in the United States with a correlation coefficient (R) of 0.411 and weighted average of 98.3%. Similarly, the statistical analysis conducted on geographies consisting of 221,182,871 people shows a moderate positive correlation between the proportion of Immigrants from Panama and percentage of population with at least kindergarten education in the United States with a correlation coefficient (R) of 0.426 and weighted average of 97.7%, a difference of 0.54%.
Nonimmigrants vs Immigrants from Panama Kindergarten

Kindergarten Correlation Summary

MeasurementNonimmigrantsImmigrants from Panama
Minimum89.3%95.1%
Maximum100.0%100.0%
Range10.7%4.9%
Mean96.8%98.8%
Median96.8%99.1%
Interquartile 25% (IQ1)95.9%98.0%
Interquartile 75% (IQ3)98.3%100.0%
Interquartile Range (IQR)2.4%2.0%
Standard Deviation (Sample)1.9%1.2%
Standard Deviation (Population)1.9%1.2%

Similar Demographics by Kindergarten

Demographics Similar to Nonimmigrants by Kindergarten

In terms of kindergarten, the demographic groups most similar to Nonimmigrants are Cypriot (98.3%, a difference of 0.0%), Choctaw (98.3%, a difference of 0.0%), Colville (98.3%, a difference of 0.0%), South African (98.3%, a difference of 0.010%), and Immigrants from Germany (98.3%, a difference of 0.010%).
DemographicsRating | RankKindergarten
Immigrants | South Africa
98.8
/100
|
#89
Exceptional
98.3%
Zimbabweans
98.8
/100
|
#90
Exceptional
98.3%
Immigrants | Western Europe
98.8
/100
|
#91
Exceptional
98.3%
Macedonians
98.7
/100
|
#92
Exceptional
98.3%
Immigrants | India
98.6
/100
|
#93
Exceptional
98.3%
South Africans
98.5
/100
|
#94
Exceptional
98.3%
Immigrants | Germany
98.5
/100
|
#95
Exceptional
98.3%
Immigrants | Nonimmigrants
98.3
/100
|
#96
Exceptional
98.3%
Cypriots
98.3
/100
|
#97
Exceptional
98.3%
Choctaw
98.2
/100
|
#98
Exceptional
98.3%
Colville
98.2
/100
|
#99
Exceptional
98.3%
Puget Sound Salish
98.1
/100
|
#100
Exceptional
98.2%
Romanians
97.8
/100
|
#101
Exceptional
98.2%
Cree
97.7
/100
|
#102
Exceptional
98.2%
Immigrants | Ireland
97.6
/100
|
#103
Exceptional
98.2%

Demographics Similar to Immigrants from Panama by Kindergarten

In terms of kindergarten, the demographic groups most similar to Immigrants from Panama are Tongan (97.7%, a difference of 0.0%), Immigrants from Morocco (97.7%, a difference of 0.010%), Immigrants from Zaire (97.7%, a difference of 0.010%), Immigrants from Sudan (97.7%, a difference of 0.010%), and Immigrants from Syria (97.7%, a difference of 0.010%).
DemographicsRating | RankKindergarten
Moroccans
8.9
/100
|
#212
Tragic
97.8%
South American Indians
7.7
/100
|
#213
Tragic
97.8%
Uruguayans
7.5
/100
|
#214
Tragic
97.8%
Immigrants | Bahamas
7.4
/100
|
#215
Tragic
97.8%
Samoans
6.9
/100
|
#216
Tragic
97.8%
Bahamians
6.6
/100
|
#217
Tragic
97.8%
Immigrants | Morocco
5.4
/100
|
#218
Tragic
97.7%
Immigrants | Panama
5.0
/100
|
#219
Tragic
97.7%
Tongans
4.8
/100
|
#220
Tragic
97.7%
Immigrants | Zaire
4.5
/100
|
#221
Tragic
97.7%
Immigrants | Sudan
4.5
/100
|
#222
Tragic
97.7%
Immigrants | Syria
4.3
/100
|
#223
Tragic
97.7%
Iraqis
3.9
/100
|
#224
Tragic
97.7%
Immigrants | Nepal
3.8
/100
|
#225
Tragic
97.7%
Sudanese
3.7
/100
|
#226
Tragic
97.7%