Yakama vs Immigrants from Sierra Leone 3 or more Vehicles in Household
COMPARE
Yakama
Immigrants from Sierra Leone
3 or more Vehicles in Household
3 or more Vehicles in Household Comparison
Yakama
Immigrants from Sierra Leone
31.0%
3 OR MORE VEHICLES IN HOUSEHOLD
100.0/ 100
METRIC RATING
1st/ 347
METRIC RANK
18.7%
3 OR MORE VEHICLES IN HOUSEHOLD
10.8/ 100
METRIC RATING
214th/ 347
METRIC RANK
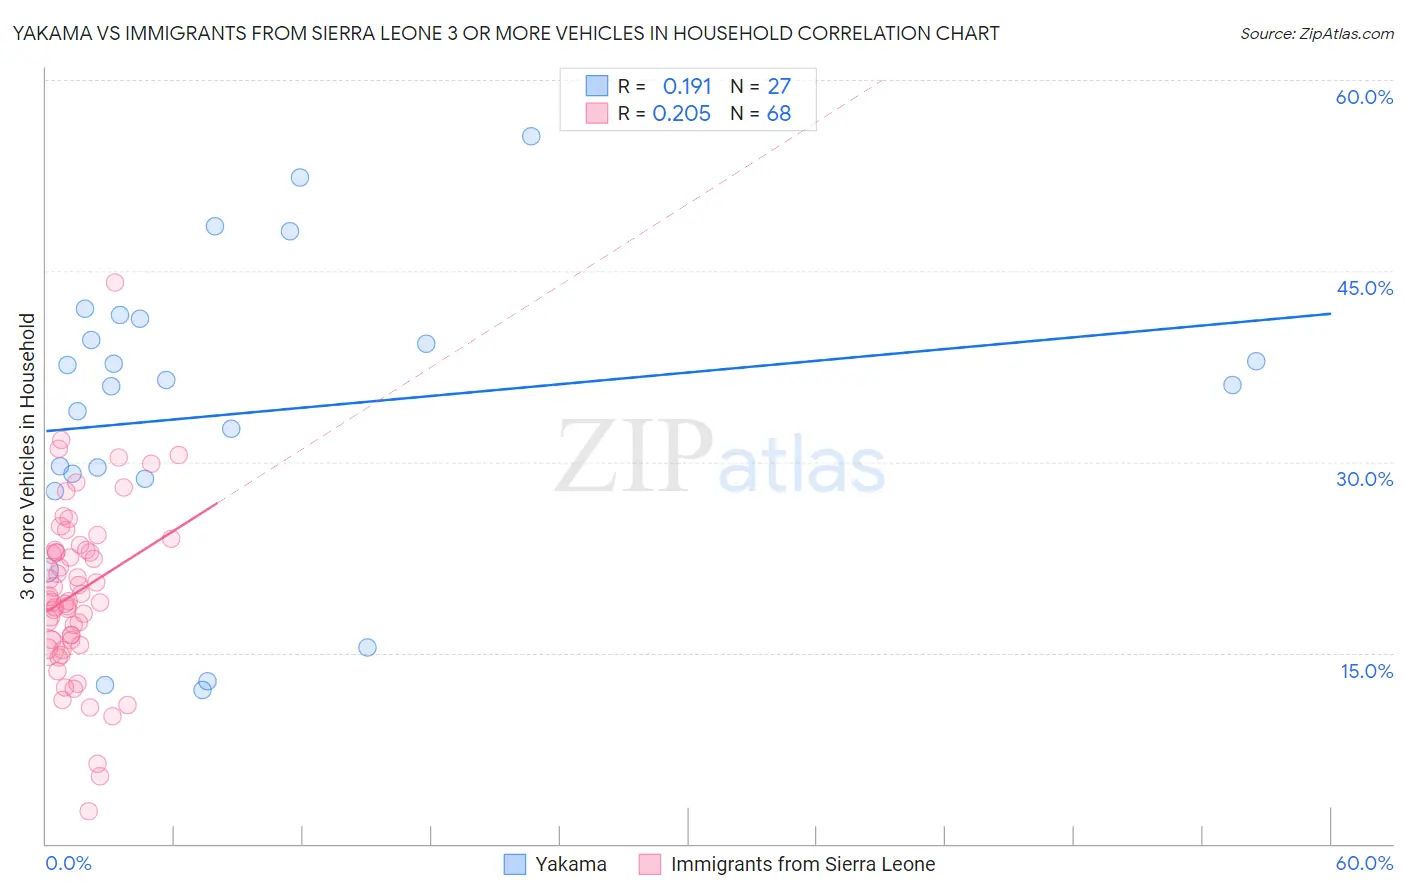
Yakama vs Immigrants from Sierra Leone 3 or more Vehicles in Household Correlation Chart
The statistical analysis conducted on geographies consisting of 19,917,800 people shows a poor positive correlation between the proportion of Yakama and percentage of households with 3 or more vehicles available in the United States with a correlation coefficient (R) of 0.191 and weighted average of 31.0%. Similarly, the statistical analysis conducted on geographies consisting of 101,640,552 people shows a weak positive correlation between the proportion of Immigrants from Sierra Leone and percentage of households with 3 or more vehicles available in the United States with a correlation coefficient (R) of 0.205 and weighted average of 18.7%, a difference of 65.5%.
3 or more Vehicles in Household Correlation Summary
| Measurement | Yakama | Immigrants from Sierra Leone |
| Minimum | 12.1% | 2.6% |
| Maximum | 55.6% | 44.1% |
| Range | 43.5% | 41.5% |
| Mean | 33.9% | 19.7% |
| Median | 36.0% | 19.1% |
| Interquartile 25% (IQ1) | 28.7% | 15.8% |
| Interquartile 75% (IQ3) | 41.3% | 23.1% |
| Interquartile Range (IQR) | 12.6% | 7.3% |
| Standard Deviation (Sample) | 11.7% | 6.8% |
| Standard Deviation (Population) | 11.4% | 6.7% |
Similar Demographics by 3 or more Vehicles in Household
Demographics Similar to Yakama by 3 or more Vehicles in Household
In terms of 3 or more vehicles in household, the demographic groups most similar to Yakama are Spanish American Indian (26.9%, a difference of 15.0%), Tongan (26.5%, a difference of 16.8%), Arapaho (26.4%, a difference of 17.1%), Puget Sound Salish (26.4%, a difference of 17.5%), and Immigrants from Fiji (26.1%, a difference of 18.9%).
| Demographics | Rating | Rank | 3 or more Vehicles in Household |
| Yakama | 100.0 /100 | #1 | Exceptional 31.0% |
| Spanish American Indians | 100.0 /100 | #2 | Exceptional 26.9% |
| Tongans | 100.0 /100 | #3 | Exceptional 26.5% |
| Arapaho | 100.0 /100 | #4 | Exceptional 26.4% |
| Puget Sound Salish | 100.0 /100 | #5 | Exceptional 26.4% |
| Immigrants | Fiji | 100.0 /100 | #6 | Exceptional 26.1% |
| Colville | 100.0 /100 | #7 | Exceptional 25.8% |
| Samoans | 100.0 /100 | #8 | Exceptional 25.0% |
| Native Hawaiians | 100.0 /100 | #9 | Exceptional 24.9% |
| Nepalese | 100.0 /100 | #10 | Exceptional 24.9% |
| Shoshone | 100.0 /100 | #11 | Exceptional 24.9% |
| Danes | 100.0 /100 | #12 | Exceptional 24.7% |
| Mexicans | 100.0 /100 | #13 | Exceptional 24.7% |
| Immigrants | Mexico | 100.0 /100 | #14 | Exceptional 24.6% |
| Hawaiians | 100.0 /100 | #15 | Exceptional 24.3% |
Demographics Similar to Immigrants from Sierra Leone by 3 or more Vehicles in Household
In terms of 3 or more vehicles in household, the demographic groups most similar to Immigrants from Sierra Leone are Eastern European (18.7%, a difference of 0.050%), Immigrants from Nigeria (18.7%, a difference of 0.10%), Immigrants from Italy (18.7%, a difference of 0.13%), Immigrants from Cuba (18.8%, a difference of 0.15%), and Panamanian (18.8%, a difference of 0.16%).
| Demographics | Rating | Rank | 3 or more Vehicles in Household |
| Immigrants | Chile | 13.6 /100 | #207 | Poor 18.8% |
| Immigrants | Burma/Myanmar | 13.6 /100 | #208 | Poor 18.8% |
| Immigrants | Egypt | 13.5 /100 | #209 | Poor 18.8% |
| Bulgarians | 13.1 /100 | #210 | Poor 18.8% |
| Immigrants | Kenya | 12.4 /100 | #211 | Poor 18.8% |
| Panamanians | 11.6 /100 | #212 | Poor 18.8% |
| Immigrants | Cuba | 11.6 /100 | #213 | Poor 18.8% |
| Immigrants | Sierra Leone | 10.8 /100 | #214 | Poor 18.7% |
| Eastern Europeans | 10.6 /100 | #215 | Poor 18.7% |
| Immigrants | Nigeria | 10.3 /100 | #216 | Poor 18.7% |
| Immigrants | Italy | 10.2 /100 | #217 | Poor 18.7% |
| Immigrants | Portugal | 8.9 /100 | #218 | Tragic 18.6% |
| Immigrants | Armenia | 8.6 /100 | #219 | Tragic 18.6% |
| Nigerians | 7.9 /100 | #220 | Tragic 18.6% |
| Immigrants | Poland | 7.5 /100 | #221 | Tragic 18.6% |