Navajo vs Okinawan Disability
COMPARE
Navajo
Okinawan
Disability
Disability Comparison
Navajo
Okinawans
14.3%
DISABILITY
0.0/ 100
METRIC RATING
330th/ 347
METRIC RANK
10.3%
DISABILITY
100.0/ 100
METRIC RATING
15th/ 347
METRIC RANK
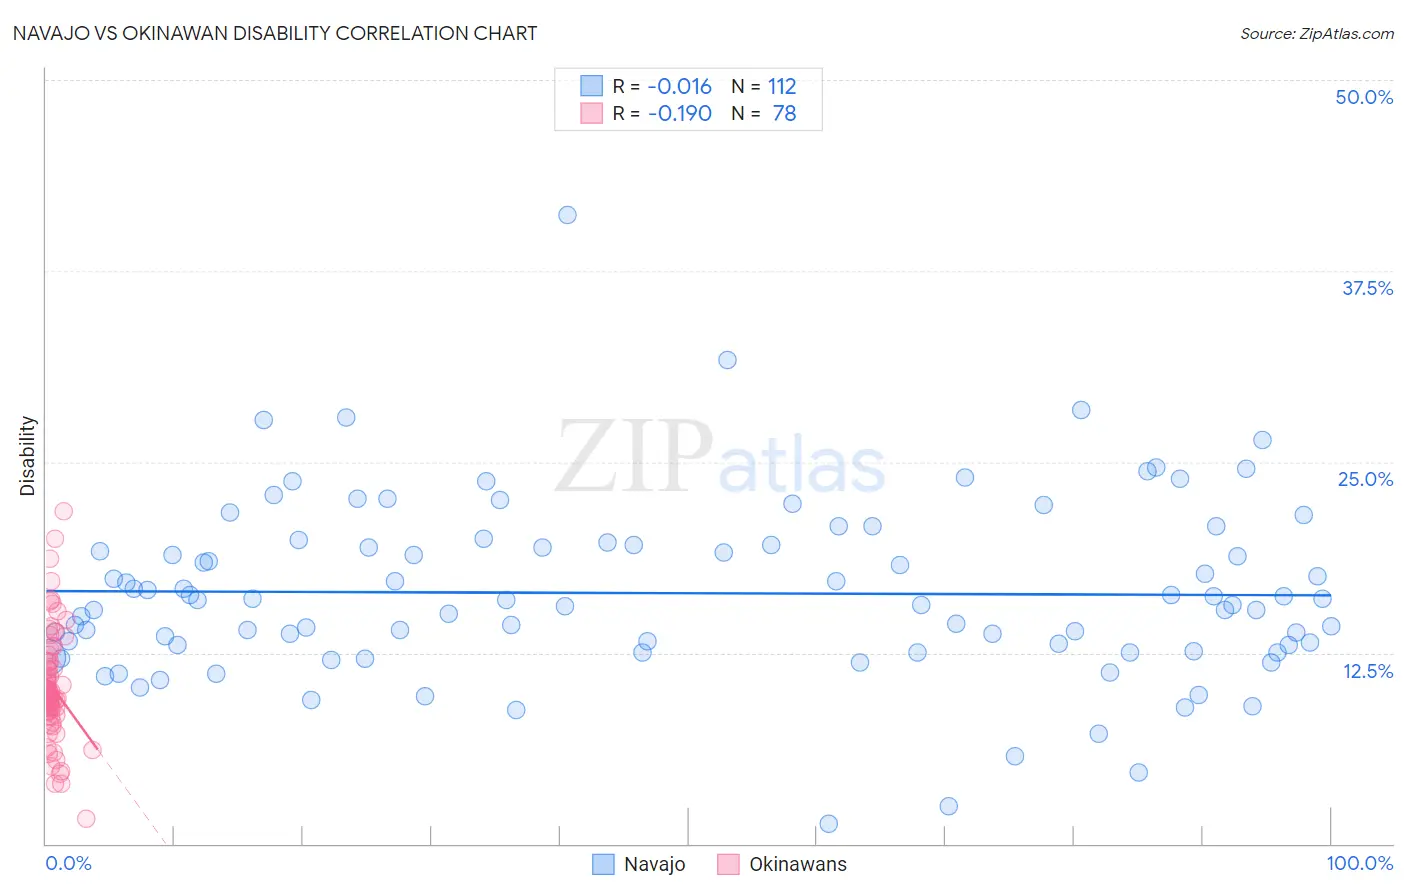
Navajo vs Okinawan Disability Correlation Chart
The statistical analysis conducted on geographies consisting of 224,790,018 people shows no correlation between the proportion of Navajo and percentage of population with a disability in the United States with a correlation coefficient (R) of -0.016 and weighted average of 14.3%. Similarly, the statistical analysis conducted on geographies consisting of 73,770,333 people shows a poor negative correlation between the proportion of Okinawans and percentage of population with a disability in the United States with a correlation coefficient (R) of -0.190 and weighted average of 10.3%, a difference of 39.1%.
Disability Correlation Summary
| Measurement | Navajo | Okinawan |
| Minimum | 1.3% | 1.6% |
| Maximum | 41.2% | 21.8% |
| Range | 39.9% | 20.2% |
| Mean | 16.4% | 10.3% |
| Median | 15.8% | 9.6% |
| Interquartile 25% (IQ1) | 12.8% | 8.6% |
| Interquartile 75% (IQ3) | 19.5% | 11.9% |
| Interquartile Range (IQR) | 6.7% | 3.3% |
| Standard Deviation (Sample) | 5.9% | 3.6% |
| Standard Deviation (Population) | 5.8% | 3.6% |
Similar Demographics by Disability
Demographics Similar to Navajo by Disability
In terms of disability, the demographic groups most similar to Navajo are Potawatomi (14.2%, a difference of 0.59%), Ottawa (14.2%, a difference of 0.71%), Immigrants from the Azores (14.2%, a difference of 0.71%), Osage (14.2%, a difference of 0.73%), and Native/Alaskan (14.2%, a difference of 0.76%).
| Demographics | Rating | Rank | Disability |
| Comanche | 0.0 /100 | #323 | Tragic 14.1% |
| Chippewa | 0.0 /100 | #324 | Tragic 14.1% |
| Natives/Alaskans | 0.0 /100 | #325 | Tragic 14.2% |
| Osage | 0.0 /100 | #326 | Tragic 14.2% |
| Ottawa | 0.0 /100 | #327 | Tragic 14.2% |
| Immigrants | Azores | 0.0 /100 | #328 | Tragic 14.2% |
| Potawatomi | 0.0 /100 | #329 | Tragic 14.2% |
| Navajo | 0.0 /100 | #330 | Tragic 14.3% |
| Alaskan Athabascans | 0.0 /100 | #331 | Tragic 14.4% |
| Pueblo | 0.0 /100 | #332 | Tragic 14.4% |
| Cajuns | 0.0 /100 | #333 | Tragic 14.6% |
| Yuman | 0.0 /100 | #334 | Tragic 14.6% |
| Tohono O'odham | 0.0 /100 | #335 | Tragic 14.8% |
| Cherokee | 0.0 /100 | #336 | Tragic 14.8% |
| Seminole | 0.0 /100 | #337 | Tragic 14.9% |
Demographics Similar to Okinawans by Disability
In terms of disability, the demographic groups most similar to Okinawans are Indian (Asian) (10.3%, a difference of 0.070%), Immigrants from Iran (10.3%, a difference of 0.13%), Immigrants from Korea (10.2%, a difference of 0.31%), Immigrants from Eastern Asia (10.2%, a difference of 0.91%), and Immigrants from Israel (10.1%, a difference of 1.1%).
| Demographics | Rating | Rank | Disability |
| Bolivians | 100.0 /100 | #8 | Exceptional 10.0% |
| Immigrants | Hong Kong | 100.0 /100 | #9 | Exceptional 10.0% |
| Immigrants | China | 100.0 /100 | #10 | Exceptional 10.1% |
| Iranians | 100.0 /100 | #11 | Exceptional 10.1% |
| Immigrants | Israel | 100.0 /100 | #12 | Exceptional 10.1% |
| Immigrants | Eastern Asia | 100.0 /100 | #13 | Exceptional 10.2% |
| Immigrants | Korea | 100.0 /100 | #14 | Exceptional 10.2% |
| Okinawans | 100.0 /100 | #15 | Exceptional 10.3% |
| Indians (Asian) | 100.0 /100 | #16 | Exceptional 10.3% |
| Immigrants | Iran | 100.0 /100 | #17 | Exceptional 10.3% |
| Burmese | 100.0 /100 | #18 | Exceptional 10.4% |
| Immigrants | Pakistan | 100.0 /100 | #19 | Exceptional 10.4% |
| Immigrants | Venezuela | 100.0 /100 | #20 | Exceptional 10.4% |
| Asians | 100.0 /100 | #21 | Exceptional 10.4% |
| Immigrants | Sri Lanka | 100.0 /100 | #22 | Exceptional 10.5% |