Navajo vs Okinawan Child Poverty Among Boys Under 16
COMPARE
Navajo
Okinawan
Child Poverty Among Boys Under 16
Child Poverty Among Boys Under 16 Comparison
Navajo
Okinawans
30.3%
CHILD POVERTY AMONG BOYS UNDER 16
0.0/ 100
METRIC RATING
343rd/ 347
METRIC RANK
13.5%
CHILD POVERTY AMONG BOYS UNDER 16
99.8/ 100
METRIC RATING
25th/ 347
METRIC RANK
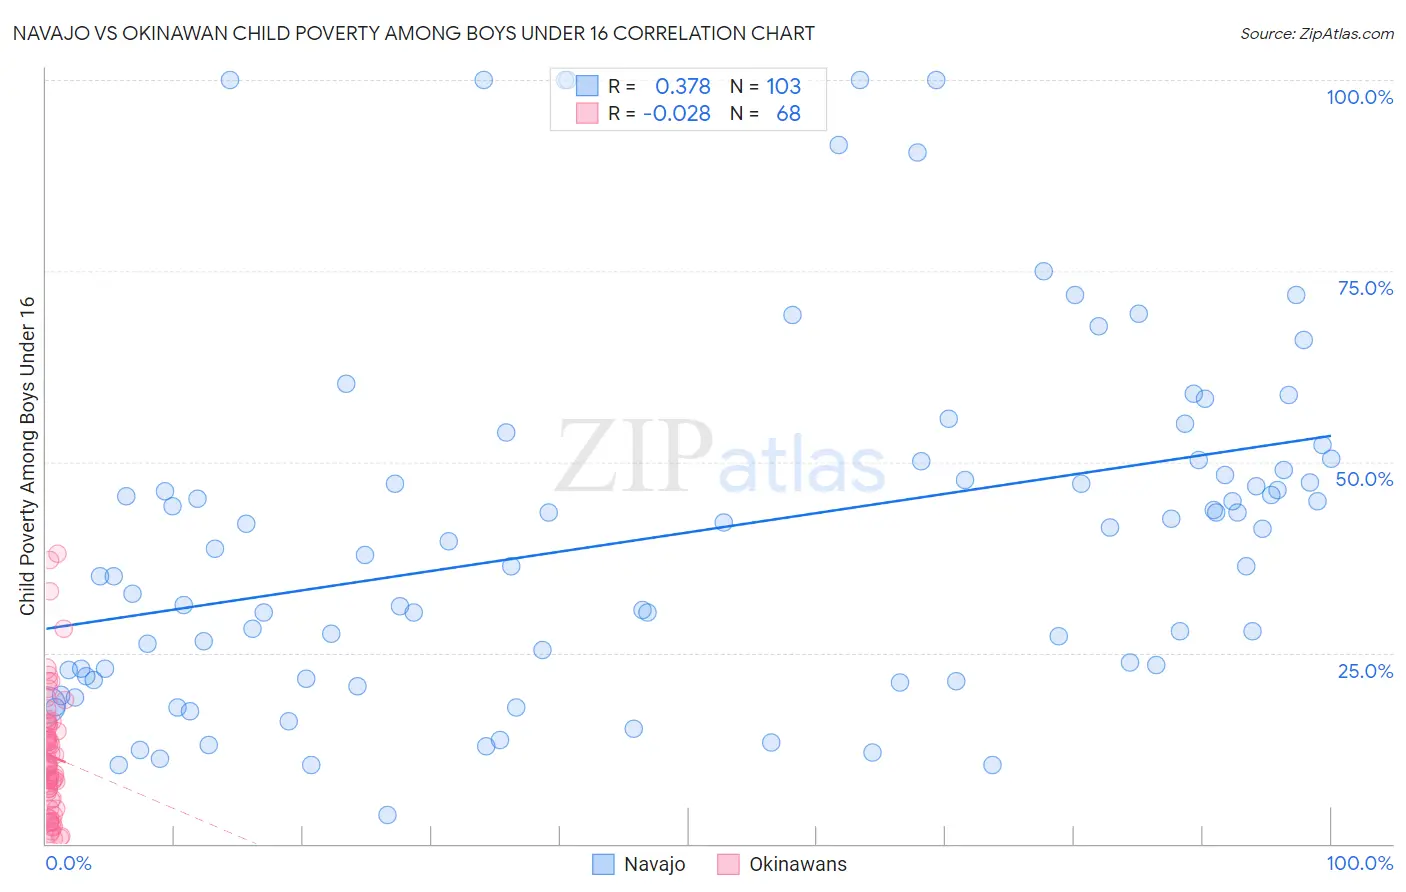
Navajo vs Okinawan Child Poverty Among Boys Under 16 Correlation Chart
The statistical analysis conducted on geographies consisting of 223,444,505 people shows a mild positive correlation between the proportion of Navajo and poverty level among boys under the age of 16 in the United States with a correlation coefficient (R) of 0.378 and weighted average of 30.3%. Similarly, the statistical analysis conducted on geographies consisting of 73,367,839 people shows no correlation between the proportion of Okinawans and poverty level among boys under the age of 16 in the United States with a correlation coefficient (R) of -0.028 and weighted average of 13.5%, a difference of 124.4%.
Child Poverty Among Boys Under 16 Correlation Summary
| Measurement | Navajo | Okinawan |
| Minimum | 3.7% | 0.64% |
| Maximum | 100.0% | 37.9% |
| Range | 96.3% | 37.3% |
| Mean | 40.5% | 11.5% |
| Median | 38.7% | 10.3% |
| Interquartile 25% (IQ1) | 22.0% | 5.8% |
| Interquartile 75% (IQ3) | 50.2% | 15.6% |
| Interquartile Range (IQR) | 28.1% | 9.8% |
| Standard Deviation (Sample) | 23.4% | 8.2% |
| Standard Deviation (Population) | 23.3% | 8.1% |
Similar Demographics by Child Poverty Among Boys Under 16
Demographics Similar to Navajo by Child Poverty Among Boys Under 16
In terms of child poverty among boys under 16, the demographic groups most similar to Navajo are Yuman (30.6%, a difference of 1.2%), Pima (29.7%, a difference of 1.8%), Tohono O'odham (31.6%, a difference of 4.2%), Immigrants from Yemen (28.9%, a difference of 5.0%), and Lumbee (31.9%, a difference of 5.4%).
| Demographics | Rating | Rank | Child Poverty Among Boys Under 16 |
| Apache | 0.0 /100 | #333 | Tragic 24.5% |
| Blacks/African Americans | 0.0 /100 | #334 | Tragic 24.5% |
| Yup'ik | 0.0 /100 | #335 | Tragic 24.7% |
| Sioux | 0.0 /100 | #336 | Tragic 25.3% |
| Cheyenne | 0.0 /100 | #337 | Tragic 25.8% |
| Hopi | 0.0 /100 | #338 | Tragic 25.9% |
| Houma | 0.0 /100 | #339 | Tragic 26.2% |
| Crow | 0.0 /100 | #340 | Tragic 26.3% |
| Immigrants | Yemen | 0.0 /100 | #341 | Tragic 28.9% |
| Pima | 0.0 /100 | #342 | Tragic 29.7% |
| Navajo | 0.0 /100 | #343 | Tragic 30.3% |
| Yuman | 0.0 /100 | #344 | Tragic 30.6% |
| Tohono O'odham | 0.0 /100 | #345 | Tragic 31.6% |
| Lumbee | 0.0 /100 | #346 | Tragic 31.9% |
| Puerto Ricans | 0.0 /100 | #347 | Tragic 32.8% |
Demographics Similar to Okinawans by Child Poverty Among Boys Under 16
In terms of child poverty among boys under 16, the demographic groups most similar to Okinawans are Immigrants from Bolivia (13.5%, a difference of 0.080%), Immigrants from Lithuania (13.5%, a difference of 0.12%), Asian (13.5%, a difference of 0.17%), Eastern European (13.5%, a difference of 0.23%), and Cypriot (13.6%, a difference of 0.42%).
| Demographics | Rating | Rank | Child Poverty Among Boys Under 16 |
| Bulgarians | 99.9 /100 | #18 | Exceptional 13.3% |
| Bolivians | 99.9 /100 | #19 | Exceptional 13.3% |
| Indians (Asian) | 99.9 /100 | #20 | Exceptional 13.3% |
| Immigrants | Eastern Asia | 99.9 /100 | #21 | Exceptional 13.3% |
| Tongans | 99.9 /100 | #22 | Exceptional 13.4% |
| Latvians | 99.9 /100 | #23 | Exceptional 13.4% |
| Immigrants | Lithuania | 99.8 /100 | #24 | Exceptional 13.5% |
| Okinawans | 99.8 /100 | #25 | Exceptional 13.5% |
| Immigrants | Bolivia | 99.8 /100 | #26 | Exceptional 13.5% |
| Asians | 99.8 /100 | #27 | Exceptional 13.5% |
| Eastern Europeans | 99.8 /100 | #28 | Exceptional 13.5% |
| Cypriots | 99.8 /100 | #29 | Exceptional 13.6% |
| Swedes | 99.8 /100 | #30 | Exceptional 13.6% |
| Turks | 99.8 /100 | #31 | Exceptional 13.6% |
| Immigrants | China | 99.8 /100 | #32 | Exceptional 13.6% |