Navajo vs Okinawan Seniors Poverty Over the Age of 75
COMPARE
Navajo
Okinawan
Seniors Poverty Over the Age of 75
Seniors Poverty Over the Age of 75 Comparison
Navajo
Okinawans
19.4%
SENIORS POVERTY OVER THE AGE OF 75
0.0/ 100
METRIC RATING
341st/ 347
METRIC RANK
12.1%
SENIORS POVERTY OVER THE AGE OF 75
56.3/ 100
METRIC RATING
165th/ 347
METRIC RANK
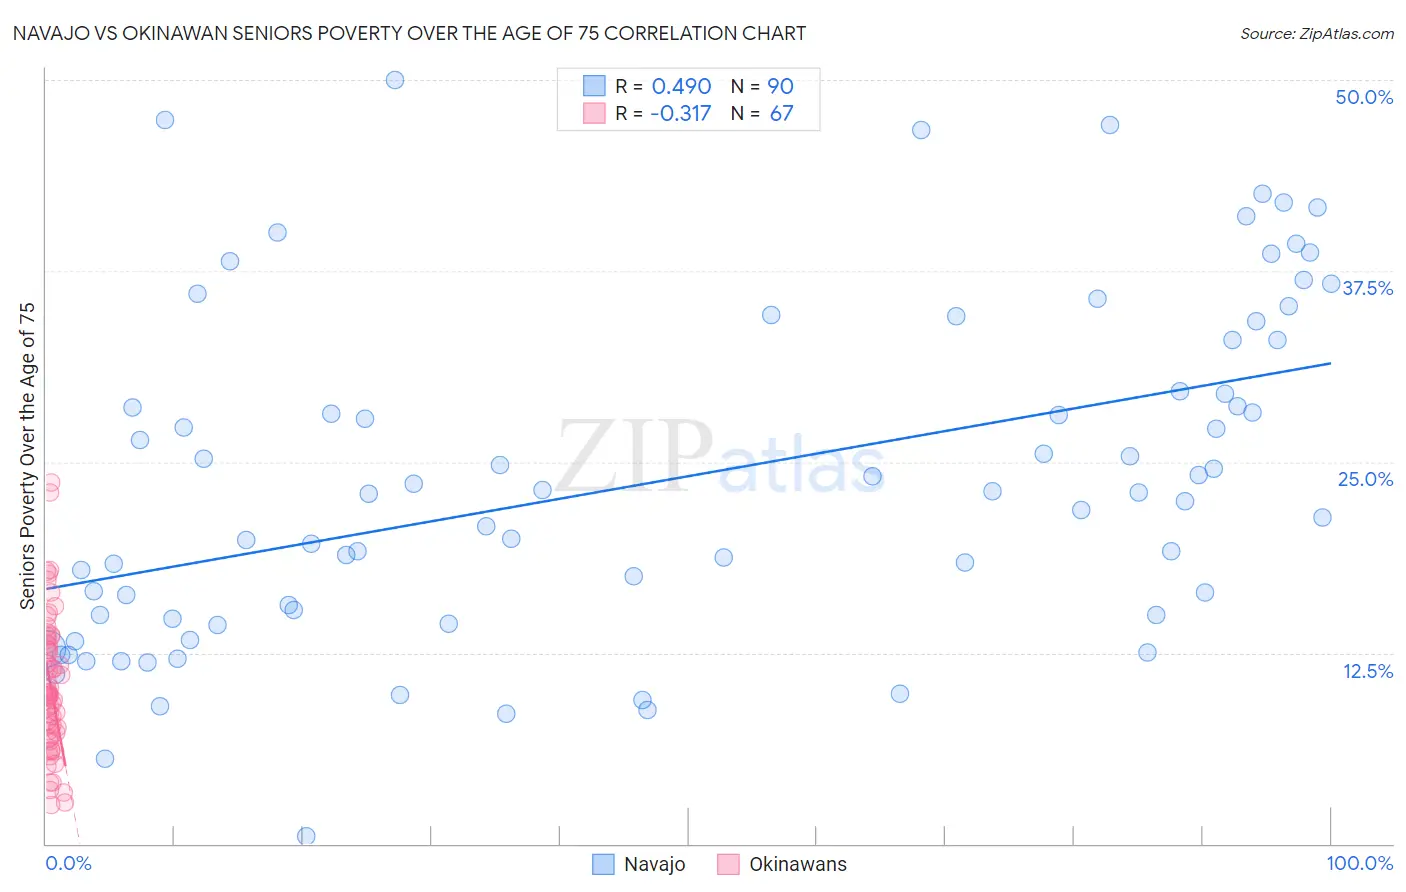
Navajo vs Okinawan Seniors Poverty Over the Age of 75 Correlation Chart
The statistical analysis conducted on geographies consisting of 222,735,587 people shows a moderate positive correlation between the proportion of Navajo and poverty level among seniors over the age of 75 in the United States with a correlation coefficient (R) of 0.490 and weighted average of 19.4%. Similarly, the statistical analysis conducted on geographies consisting of 73,553,307 people shows a mild negative correlation between the proportion of Okinawans and poverty level among seniors over the age of 75 in the United States with a correlation coefficient (R) of -0.317 and weighted average of 12.1%, a difference of 59.8%.
Seniors Poverty Over the Age of 75 Correlation Summary
| Measurement | Navajo | Okinawan |
| Minimum | 0.49% | 2.6% |
| Maximum | 50.0% | 23.6% |
| Range | 49.5% | 21.1% |
| Mean | 23.8% | 10.4% |
| Median | 22.9% | 9.8% |
| Interquartile 25% (IQ1) | 15.0% | 7.3% |
| Interquartile 75% (IQ3) | 32.9% | 13.1% |
| Interquartile Range (IQR) | 18.0% | 5.8% |
| Standard Deviation (Sample) | 11.1% | 4.5% |
| Standard Deviation (Population) | 11.0% | 4.4% |
Similar Demographics by Seniors Poverty Over the Age of 75
Demographics Similar to Navajo by Seniors Poverty Over the Age of 75
In terms of seniors poverty over the age of 75, the demographic groups most similar to Navajo are Dominican (19.6%, a difference of 1.2%), Tohono O'odham (19.1%, a difference of 1.3%), Lumbee (19.7%, a difference of 1.9%), Immigrants from Cuba (19.9%, a difference of 2.7%), and Hopi (18.9%, a difference of 2.8%).
| Demographics | Rating | Rank | Seniors Poverty Over the Age of 75 |
| Immigrants | Nicaragua | 0.0 /100 | #333 | Tragic 17.6% |
| Immigrants | Grenada | 0.0 /100 | #334 | Tragic 17.8% |
| Cubans | 0.0 /100 | #335 | Tragic 18.0% |
| Immigrants | Caribbean | 0.0 /100 | #336 | Tragic 18.2% |
| Yakama | 0.0 /100 | #337 | Tragic 18.3% |
| Immigrants | Cabo Verde | 0.0 /100 | #338 | Tragic 18.5% |
| Hopi | 0.0 /100 | #339 | Tragic 18.9% |
| Tohono O'odham | 0.0 /100 | #340 | Tragic 19.1% |
| Navajo | 0.0 /100 | #341 | Tragic 19.4% |
| Dominicans | 0.0 /100 | #342 | Tragic 19.6% |
| Lumbee | 0.0 /100 | #343 | Tragic 19.7% |
| Immigrants | Cuba | 0.0 /100 | #344 | Tragic 19.9% |
| Immigrants | Dominican Republic | 0.0 /100 | #345 | Tragic 20.1% |
| Puerto Ricans | 0.0 /100 | #346 | Tragic 23.2% |
| Pima | 0.0 /100 | #347 | Tragic 23.9% |
Demographics Similar to Okinawans by Seniors Poverty Over the Age of 75
In terms of seniors poverty over the age of 75, the demographic groups most similar to Okinawans are Potawatomi (12.1%, a difference of 0.090%), Egyptian (12.1%, a difference of 0.12%), Immigrants from Switzerland (12.1%, a difference of 0.14%), Immigrants from Greece (12.1%, a difference of 0.16%), and Immigrants from Syria (12.2%, a difference of 0.20%).
| Demographics | Rating | Rank | Seniors Poverty Over the Age of 75 |
| Portuguese | 61.3 /100 | #158 | Good 12.1% |
| Immigrants | Middle Africa | 61.2 /100 | #159 | Good 12.1% |
| Immigrants | Eastern Africa | 60.9 /100 | #160 | Good 12.1% |
| Immigrants | Norway | 60.6 /100 | #161 | Good 12.1% |
| Immigrants | Serbia | 60.2 /100 | #162 | Good 12.1% |
| Immigrants | Greece | 58.2 /100 | #163 | Average 12.1% |
| Potawatomi | 57.4 /100 | #164 | Average 12.1% |
| Okinawans | 56.3 /100 | #165 | Average 12.1% |
| Egyptians | 54.8 /100 | #166 | Average 12.1% |
| Immigrants | Switzerland | 54.5 /100 | #167 | Average 12.1% |
| Immigrants | Syria | 53.9 /100 | #168 | Average 12.2% |
| Immigrants | Egypt | 53.7 /100 | #169 | Average 12.2% |
| Immigrants | Thailand | 52.0 /100 | #170 | Average 12.2% |
| Spaniards | 51.6 /100 | #171 | Average 12.2% |
| Immigrants | Fiji | 51.5 /100 | #172 | Average 12.2% |