Greek vs Crow No Vehicles in Household
COMPARE
Greek
Crow
No Vehicles in Household
No Vehicles in Household Comparison
Greeks
Crow
9.5%
NO VEHICLES IN HOUSEHOLD
92.9/ 100
METRIC RATING
118th/ 347
METRIC RANK
11.0%
NO VEHICLES IN HOUSEHOLD
14.2/ 100
METRIC RATING
211th/ 347
METRIC RANK
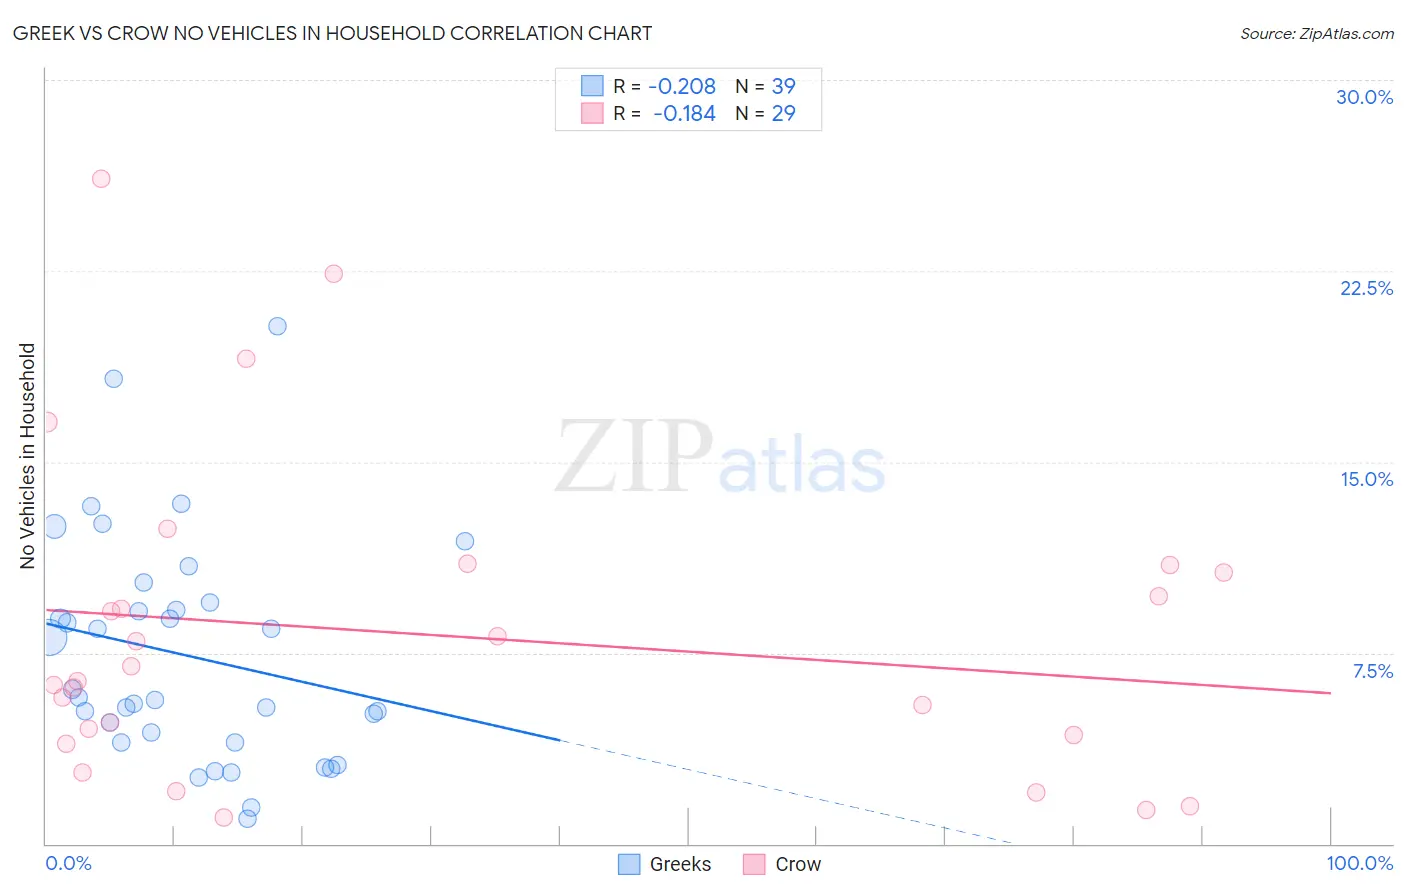
Greek vs Crow No Vehicles in Household Correlation Chart
The statistical analysis conducted on geographies consisting of 480,584,341 people shows a weak negative correlation between the proportion of Greeks and percentage of households with no vehicle available in the United States with a correlation coefficient (R) of -0.208 and weighted average of 9.5%. Similarly, the statistical analysis conducted on geographies consisting of 59,160,516 people shows a poor negative correlation between the proportion of Crow and percentage of households with no vehicle available in the United States with a correlation coefficient (R) of -0.184 and weighted average of 11.0%, a difference of 16.2%.
No Vehicles in Household Correlation Summary
| Measurement | Greek | Crow |
| Minimum | 1.00% | 1.0% |
| Maximum | 20.3% | 26.1% |
| Range | 19.3% | 25.1% |
| Mean | 7.4% | 8.2% |
| Median | 5.7% | 6.4% |
| Interquartile 25% (IQ1) | 4.0% | 4.1% |
| Interquartile 75% (IQ3) | 9.5% | 10.8% |
| Interquartile Range (IQR) | 5.5% | 6.7% |
| Standard Deviation (Sample) | 4.4% | 6.2% |
| Standard Deviation (Population) | 4.4% | 6.1% |
Similar Demographics by No Vehicles in Household
Demographics Similar to Greeks by No Vehicles in Household
In terms of no vehicles in household, the demographic groups most similar to Greeks are Fijian (9.5%, a difference of 0.11%), Immigrants from Thailand (9.5%, a difference of 0.17%), Puget Sound Salish (9.5%, a difference of 0.27%), Costa Rican (9.5%, a difference of 0.32%), and Chippewa (9.4%, a difference of 0.55%).
| Demographics | Rating | Rank | No Vehicles in Household |
| Immigrants | Kuwait | 95.1 /100 | #111 | Exceptional 9.4% |
| Armenians | 95.0 /100 | #112 | Exceptional 9.4% |
| Immigrants | Netherlands | 94.8 /100 | #113 | Exceptional 9.4% |
| Serbians | 94.3 /100 | #114 | Exceptional 9.4% |
| Navajo | 94.2 /100 | #115 | Exceptional 9.4% |
| Japanese | 94.1 /100 | #116 | Exceptional 9.4% |
| Chippewa | 93.8 /100 | #117 | Exceptional 9.4% |
| Greeks | 92.9 /100 | #118 | Exceptional 9.5% |
| Fijians | 92.7 /100 | #119 | Exceptional 9.5% |
| Immigrants | Thailand | 92.6 /100 | #120 | Exceptional 9.5% |
| Puget Sound Salish | 92.4 /100 | #121 | Exceptional 9.5% |
| Costa Ricans | 92.3 /100 | #122 | Exceptional 9.5% |
| Blackfeet | 91.4 /100 | #123 | Exceptional 9.6% |
| Immigrants | Korea | 90.9 /100 | #124 | Exceptional 9.6% |
| Immigrants | Cameroon | 90.6 /100 | #125 | Exceptional 9.6% |
Demographics Similar to Crow by No Vehicles in Household
In terms of no vehicles in household, the demographic groups most similar to Crow are Immigrants from Western Asia (11.0%, a difference of 0.090%), Apache (11.0%, a difference of 0.16%), Pennsylvania German (11.0%, a difference of 0.33%), Immigrants from Italy (11.0%, a difference of 0.36%), and Sierra Leonean (11.0%, a difference of 0.37%).
| Demographics | Rating | Rank | No Vehicles in Household |
| Guatemalans | 16.1 /100 | #204 | Poor 11.0% |
| Immigrants | Chile | 15.9 /100 | #205 | Poor 11.0% |
| Somalis | 15.9 /100 | #206 | Poor 11.0% |
| Sierra Leoneans | 15.7 /100 | #207 | Poor 11.0% |
| Immigrants | Italy | 15.6 /100 | #208 | Poor 11.0% |
| Pennsylvania Germans | 15.5 /100 | #209 | Poor 11.0% |
| Apache | 14.8 /100 | #210 | Poor 11.0% |
| Crow | 14.2 /100 | #211 | Poor 11.0% |
| Immigrants | Western Asia | 13.9 /100 | #212 | Poor 11.0% |
| Immigrants | Hungary | 12.3 /100 | #213 | Poor 11.1% |
| Immigrants | Denmark | 12.1 /100 | #214 | Poor 11.1% |
| Immigrants | Sri Lanka | 10.6 /100 | #215 | Poor 11.2% |
| Immigrants | Argentina | 10.6 /100 | #216 | Poor 11.2% |
| Dutch West Indians | 10.2 /100 | #217 | Poor 11.2% |
| Immigrants | Guatemala | 10.0 /100 | #218 | Tragic 11.2% |