West Indian vs Crow No Vehicles in Household
COMPARE
West Indian
Crow
No Vehicles in Household
No Vehicles in Household Comparison
West Indians
Crow
23.7%
NO VEHICLES IN HOUSEHOLD
0.0/ 100
METRIC RATING
330th/ 347
METRIC RANK
11.0%
NO VEHICLES IN HOUSEHOLD
14.2/ 100
METRIC RATING
211th/ 347
METRIC RANK
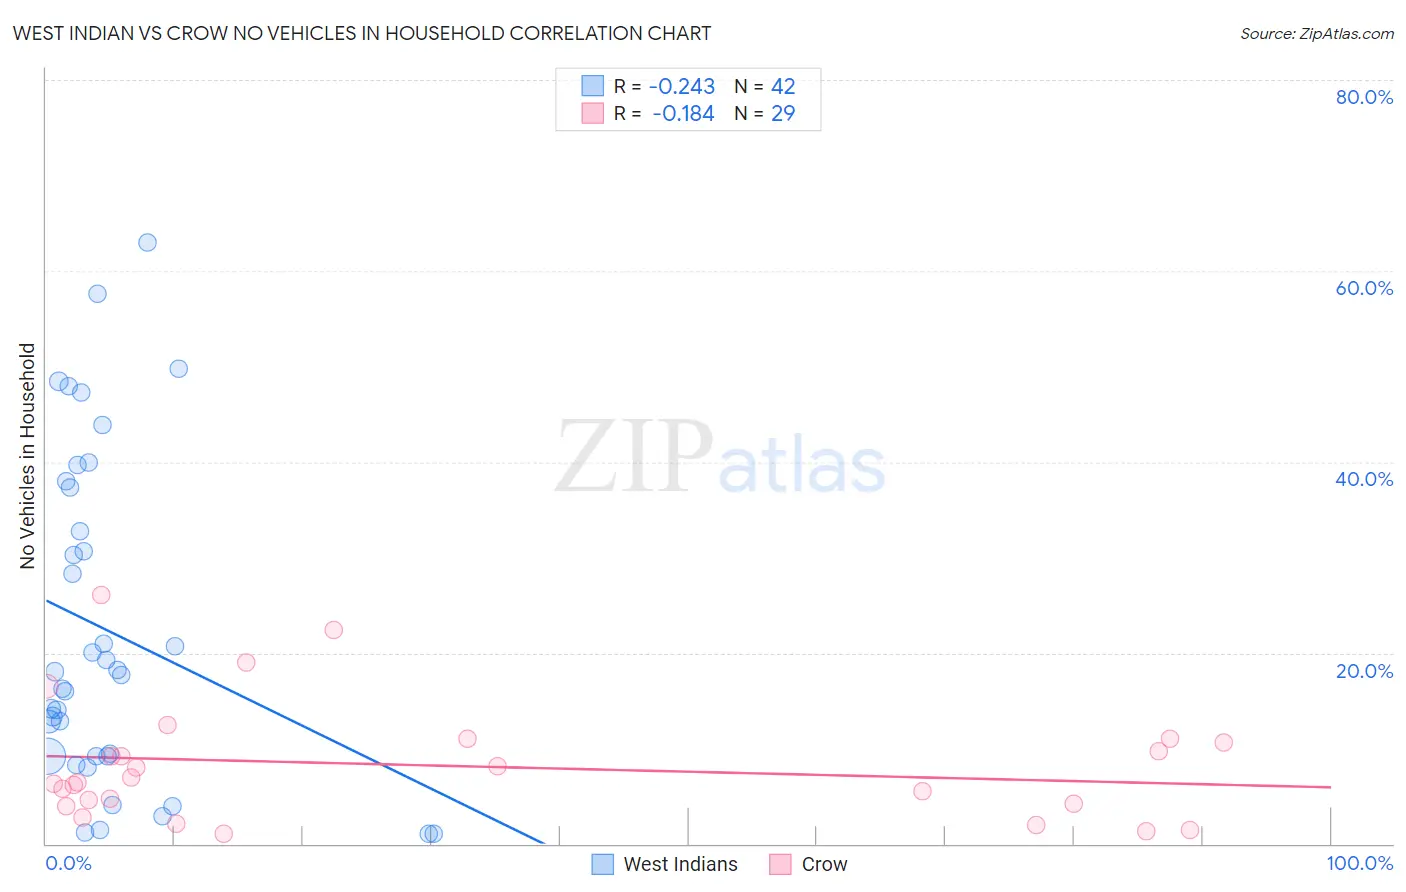
West Indian vs Crow No Vehicles in Household Correlation Chart
The statistical analysis conducted on geographies consisting of 253,703,061 people shows a weak negative correlation between the proportion of West Indians and percentage of households with no vehicle available in the United States with a correlation coefficient (R) of -0.243 and weighted average of 23.7%. Similarly, the statistical analysis conducted on geographies consisting of 59,160,516 people shows a poor negative correlation between the proportion of Crow and percentage of households with no vehicle available in the United States with a correlation coefficient (R) of -0.184 and weighted average of 11.0%, a difference of 114.8%.
No Vehicles in Household Correlation Summary
| Measurement | West Indian | Crow |
| Minimum | 1.0% | 1.0% |
| Maximum | 63.0% | 26.1% |
| Range | 62.0% | 25.1% |
| Mean | 22.3% | 8.2% |
| Median | 17.9% | 6.4% |
| Interquartile 25% (IQ1) | 9.2% | 4.1% |
| Interquartile 75% (IQ3) | 37.3% | 10.8% |
| Interquartile Range (IQR) | 28.1% | 6.7% |
| Standard Deviation (Sample) | 17.0% | 6.2% |
| Standard Deviation (Population) | 16.8% | 6.1% |
Similar Demographics by No Vehicles in Household
Demographics Similar to West Indians by No Vehicles in Household
In terms of no vehicles in household, the demographic groups most similar to West Indians are Trinidadian and Tobagonian (23.7%, a difference of 0.18%), Immigrants from Ecuador (23.8%, a difference of 0.51%), Immigrants from Trinidad and Tobago (24.6%, a difference of 3.9%), Ecuadorian (22.8%, a difference of 4.2%), and Immigrants from Dominica (22.2%, a difference of 6.6%).
| Demographics | Rating | Rank | No Vehicles in Household |
| Immigrants | Yemen | 0.0 /100 | #323 | Tragic 19.5% |
| Immigrants | Caribbean | 0.0 /100 | #324 | Tragic 19.6% |
| Senegalese | 0.0 /100 | #325 | Tragic 19.8% |
| Immigrants | West Indies | 0.0 /100 | #326 | Tragic 20.5% |
| Immigrants | Senegal | 0.0 /100 | #327 | Tragic 21.1% |
| Immigrants | Dominica | 0.0 /100 | #328 | Tragic 22.2% |
| Ecuadorians | 0.0 /100 | #329 | Tragic 22.8% |
| West Indians | 0.0 /100 | #330 | Tragic 23.7% |
| Trinidadians and Tobagonians | 0.0 /100 | #331 | Tragic 23.7% |
| Immigrants | Ecuador | 0.0 /100 | #332 | Tragic 23.8% |
| Immigrants | Trinidad and Tobago | 0.0 /100 | #333 | Tragic 24.6% |
| Immigrants | Bangladesh | 0.0 /100 | #334 | Tragic 25.8% |
| Barbadians | 0.0 /100 | #335 | Tragic 26.1% |
| Vietnamese | 0.0 /100 | #336 | Tragic 26.2% |
| Immigrants | Uzbekistan | 0.0 /100 | #337 | Tragic 26.7% |
Demographics Similar to Crow by No Vehicles in Household
In terms of no vehicles in household, the demographic groups most similar to Crow are Immigrants from Western Asia (11.0%, a difference of 0.090%), Apache (11.0%, a difference of 0.16%), Pennsylvania German (11.0%, a difference of 0.33%), Immigrants from Italy (11.0%, a difference of 0.36%), and Sierra Leonean (11.0%, a difference of 0.37%).
| Demographics | Rating | Rank | No Vehicles in Household |
| Guatemalans | 16.1 /100 | #204 | Poor 11.0% |
| Immigrants | Chile | 15.9 /100 | #205 | Poor 11.0% |
| Somalis | 15.9 /100 | #206 | Poor 11.0% |
| Sierra Leoneans | 15.7 /100 | #207 | Poor 11.0% |
| Immigrants | Italy | 15.6 /100 | #208 | Poor 11.0% |
| Pennsylvania Germans | 15.5 /100 | #209 | Poor 11.0% |
| Apache | 14.8 /100 | #210 | Poor 11.0% |
| Crow | 14.2 /100 | #211 | Poor 11.0% |
| Immigrants | Western Asia | 13.9 /100 | #212 | Poor 11.0% |
| Immigrants | Hungary | 12.3 /100 | #213 | Poor 11.1% |
| Immigrants | Denmark | 12.1 /100 | #214 | Poor 11.1% |
| Immigrants | Sri Lanka | 10.6 /100 | #215 | Poor 11.2% |
| Immigrants | Argentina | 10.6 /100 | #216 | Poor 11.2% |
| Dutch West Indians | 10.2 /100 | #217 | Poor 11.2% |
| Immigrants | Guatemala | 10.0 /100 | #218 | Tragic 11.2% |