Native/Alaskan vs Belgian Householder Income Under 25 years
COMPARE
Native/Alaskan
Belgian
Householder Income Under 25 years
Householder Income Under 25 years Comparison
Natives/Alaskans
Belgians
$47,704
HOUSEHOLDER INCOME UNDER 25 YEARS
0.0/ 100
METRIC RATING
306th/ 347
METRIC RANK
$50,113
HOUSEHOLDER INCOME UNDER 25 YEARS
0.6/ 100
METRIC RATING
265th/ 347
METRIC RANK
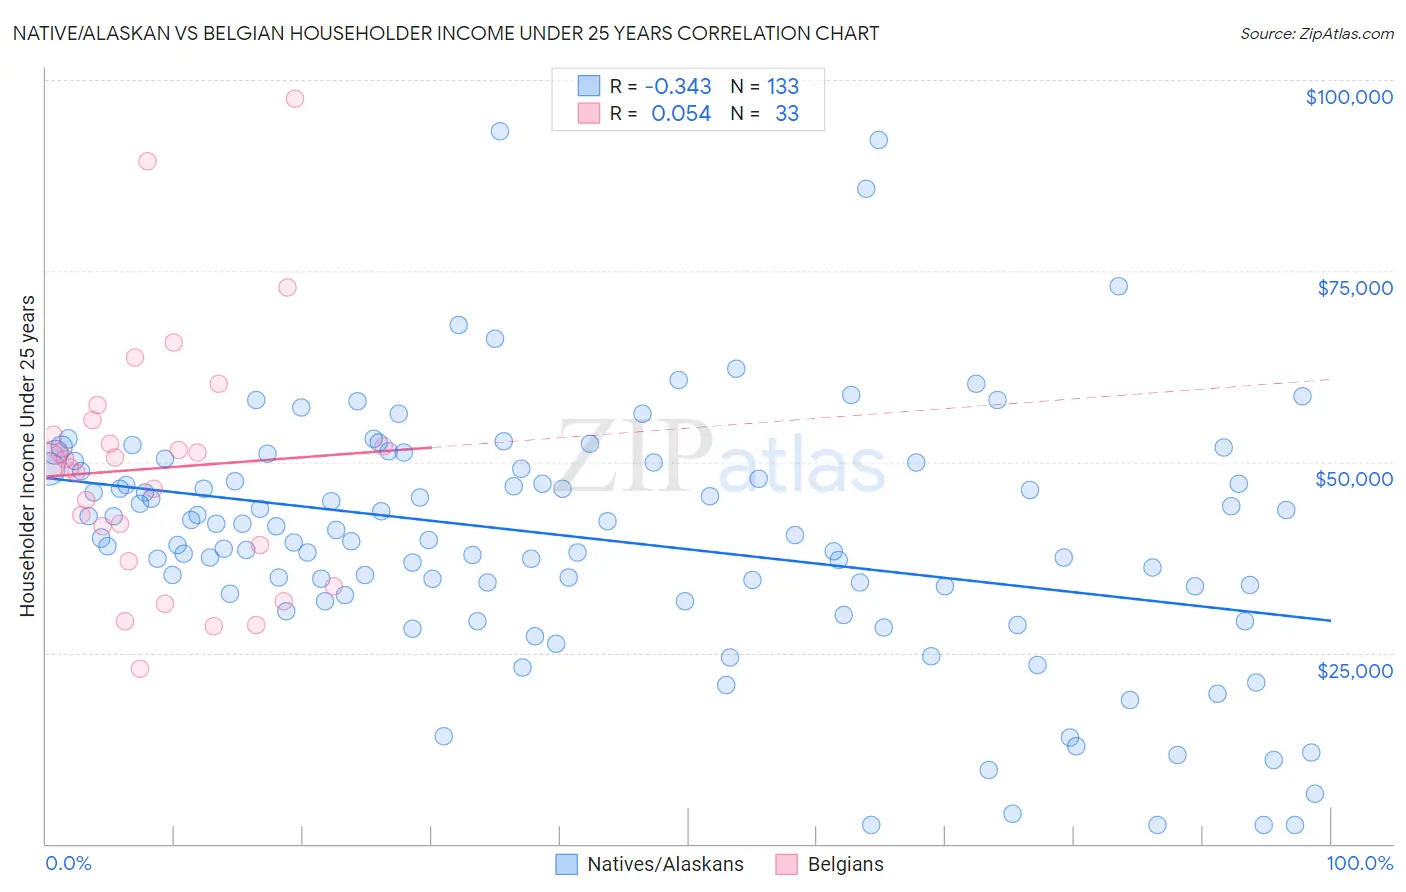
Native/Alaskan vs Belgian Householder Income Under 25 years Correlation Chart
The statistical analysis conducted on geographies consisting of 416,135,889 people shows a mild negative correlation between the proportion of Natives/Alaskans and household income with householder under the age of 25 in the United States with a correlation coefficient (R) of -0.343 and weighted average of $47,704. Similarly, the statistical analysis conducted on geographies consisting of 302,930,390 people shows a slight positive correlation between the proportion of Belgians and household income with householder under the age of 25 in the United States with a correlation coefficient (R) of 0.054 and weighted average of $50,113, a difference of 5.1%.
Householder Income Under 25 years Correlation Summary
| Measurement | Native/Alaskan | Belgian |
| Minimum | $2,499 | $22,948 |
| Maximum | $93,365 | $97,500 |
| Range | $90,866 | $74,552 |
| Mean | $40,011 | $49,189 |
| Median | $40,469 | $50,156 |
| Interquartile 25% (IQ1) | $32,640 | $38,023 |
| Interquartile 75% (IQ3) | $49,547 | $54,461 |
| Interquartile Range (IQR) | $16,907 | $16,438 |
| Standard Deviation (Sample) | $16,339 | $16,294 |
| Standard Deviation (Population) | $16,277 | $16,045 |
Similar Demographics by Householder Income Under 25 years
Demographics Similar to Natives/Alaskans by Householder Income Under 25 years
In terms of householder income under 25 years, the demographic groups most similar to Natives/Alaskans are Bangladeshi ($47,589, a difference of 0.24%), Cherokee ($47,848, a difference of 0.30%), Comanche ($47,518, a difference of 0.39%), Menominee ($47,907, a difference of 0.43%), and Immigrants from Middle Africa ($47,916, a difference of 0.44%).
| Demographics | Rating | Rank | Householder Income Under 25 years |
| Immigrants | Honduras | 0.0 /100 | #299 | Tragic $48,267 |
| Immigrants | Somalia | 0.0 /100 | #300 | Tragic $48,135 |
| Immigrants | Kuwait | 0.0 /100 | #301 | Tragic $48,126 |
| Immigrants | Liberia | 0.0 /100 | #302 | Tragic $47,981 |
| Immigrants | Middle Africa | 0.0 /100 | #303 | Tragic $47,916 |
| Menominee | 0.0 /100 | #304 | Tragic $47,907 |
| Cherokee | 0.0 /100 | #305 | Tragic $47,848 |
| Natives/Alaskans | 0.0 /100 | #306 | Tragic $47,704 |
| Bangladeshis | 0.0 /100 | #307 | Tragic $47,589 |
| Comanche | 0.0 /100 | #308 | Tragic $47,518 |
| U.S. Virgin Islanders | 0.0 /100 | #309 | Tragic $47,448 |
| Iroquois | 0.0 /100 | #310 | Tragic $47,380 |
| Ottawa | 0.0 /100 | #311 | Tragic $47,366 |
| Bermudans | 0.0 /100 | #312 | Tragic $47,359 |
| Delaware | 0.0 /100 | #313 | Tragic $47,159 |
Demographics Similar to Belgians by Householder Income Under 25 years
In terms of householder income under 25 years, the demographic groups most similar to Belgians are Immigrants from Venezuela ($50,109, a difference of 0.010%), Fijian ($50,132, a difference of 0.040%), Immigrants from Laos ($50,041, a difference of 0.14%), Immigrants from Dominican Republic ($50,204, a difference of 0.18%), and Venezuelan ($50,011, a difference of 0.20%).
| Demographics | Rating | Rank | Householder Income Under 25 years |
| Whites/Caucasians | 1.1 /100 | #258 | Tragic $50,336 |
| Immigrants | Dominica | 1.0 /100 | #259 | Tragic $50,301 |
| Hispanics or Latinos | 0.9 /100 | #260 | Tragic $50,279 |
| Hungarians | 0.9 /100 | #261 | Tragic $50,247 |
| Haitians | 0.8 /100 | #262 | Tragic $50,231 |
| Immigrants | Dominican Republic | 0.8 /100 | #263 | Tragic $50,204 |
| Fijians | 0.6 /100 | #264 | Tragic $50,132 |
| Belgians | 0.6 /100 | #265 | Tragic $50,113 |
| Immigrants | Venezuela | 0.6 /100 | #266 | Tragic $50,109 |
| Immigrants | Laos | 0.5 /100 | #267 | Tragic $50,041 |
| Venezuelans | 0.5 /100 | #268 | Tragic $50,011 |
| Ute | 0.5 /100 | #269 | Tragic $49,997 |
| Mexicans | 0.5 /100 | #270 | Tragic $49,989 |
| Taiwanese | 0.3 /100 | #271 | Tragic $49,804 |
| Colville | 0.3 /100 | #272 | Tragic $49,774 |