Immigrants from Morocco vs Immigrants from Ethiopia 3 or more Vehicles in Household
COMPARE
Immigrants from Morocco
Immigrants from Ethiopia
3 or more Vehicles in Household
3 or more Vehicles in Household Comparison
Immigrants from Morocco
Immigrants from Ethiopia
16.3%
3 OR MORE VEHICLES IN HOUSEHOLD
0.0/ 100
METRIC RATING
305th/ 347
METRIC RANK
17.9%
3 OR MORE VEHICLES IN HOUSEHOLD
1.3/ 100
METRIC RATING
253rd/ 347
METRIC RANK
Immigrants from Morocco vs Immigrants from Ethiopia 3 or more Vehicles in Household Correlation Chart
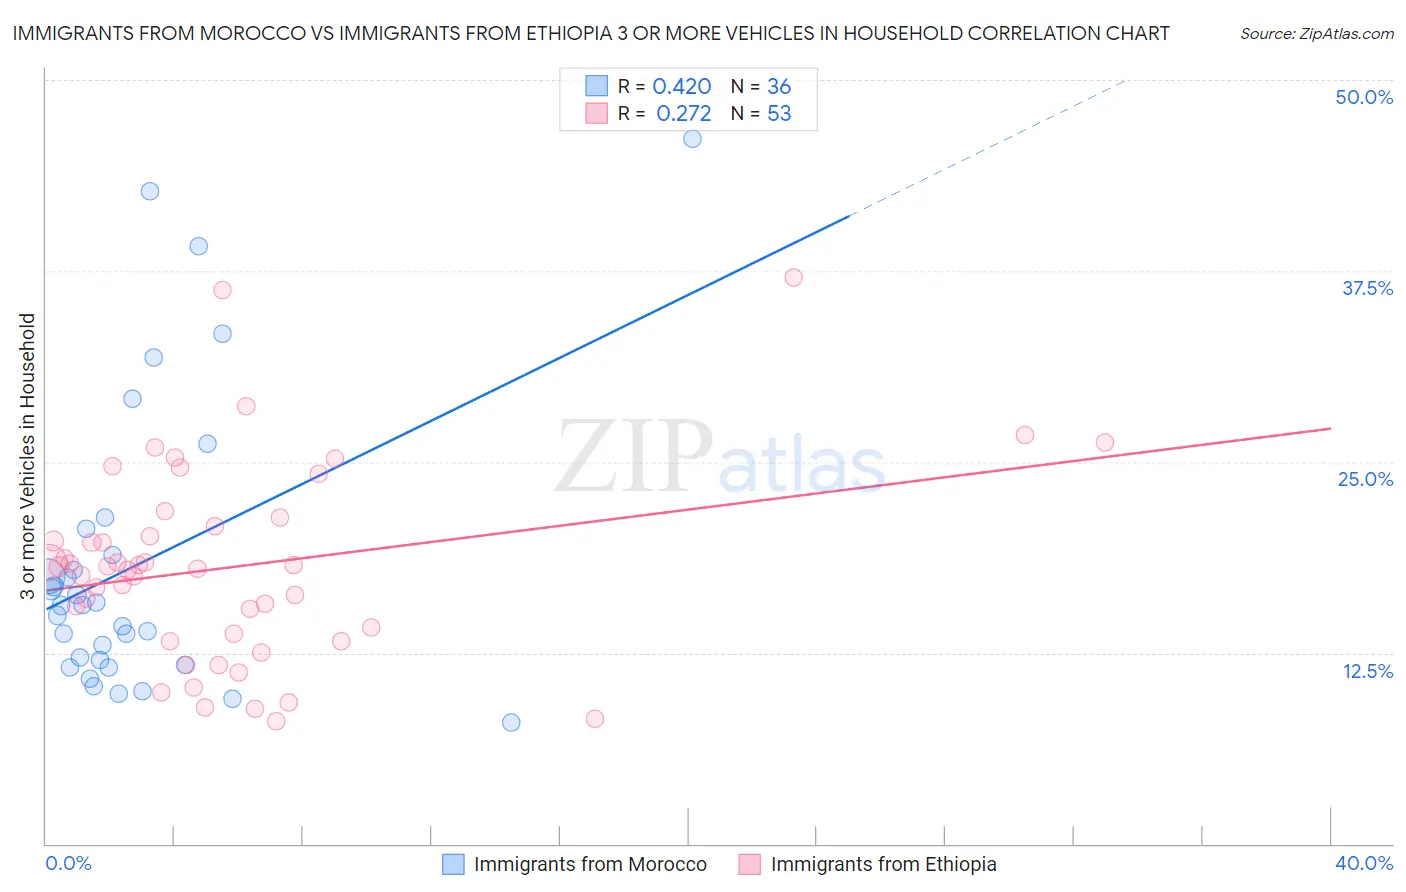
The statistical analysis conducted on geographies consisting of 178,908,758 people shows a moderate positive correlation between the proportion of Immigrants from Morocco and percentage of households with 3 or more vehicles available in the United States with a correlation coefficient (R) of 0.420 and weighted average of 16.3%. Similarly, the statistical analysis conducted on geographies consisting of 211,428,761 people shows a weak positive correlation between the proportion of Immigrants from Ethiopia and percentage of households with 3 or more vehicles available in the United States with a correlation coefficient (R) of 0.272 and weighted average of 17.9%, a difference of 9.7%.
3 or more Vehicles in Household Correlation Summary
| Measurement | Immigrants from Morocco | Immigrants from Ethiopia |
| Minimum | 7.9% | 8.0% |
| Maximum | 46.2% | 37.1% |
| Range | 38.2% | 29.0% |
| Mean | 18.3% | 18.1% |
| Median | 15.6% | 18.1% |
| Interquartile 25% (IQ1) | 11.8% | 13.5% |
| Interquartile 75% (IQ3) | 19.8% | 21.1% |
| Interquartile Range (IQR) | 8.0% | 7.6% |
| Standard Deviation (Sample) | 9.6% | 6.4% |
| Standard Deviation (Population) | 9.5% | 6.3% |
Similar Demographics by 3 or more Vehicles in Household
Demographics Similar to Immigrants from Morocco by 3 or more Vehicles in Household
In terms of 3 or more vehicles in household, the demographic groups most similar to Immigrants from Morocco are Ghanaian (16.4%, a difference of 0.26%), Immigrants from Serbia (16.4%, a difference of 0.74%), Somali (16.2%, a difference of 0.82%), Immigrants from Ghana (16.2%, a difference of 0.96%), and Immigrants from Greece (16.5%, a difference of 1.0%).
| Demographics | Rating | Rank | 3 or more Vehicles in Household |
| Immigrants | Zaire | 0.1 /100 | #298 | Tragic 16.7% |
| Immigrants | South America | 0.1 /100 | #299 | Tragic 16.7% |
| Cypriots | 0.0 /100 | #300 | Tragic 16.6% |
| Paraguayans | 0.0 /100 | #301 | Tragic 16.6% |
| Immigrants | Greece | 0.0 /100 | #302 | Tragic 16.5% |
| Immigrants | Serbia | 0.0 /100 | #303 | Tragic 16.4% |
| Ghanaians | 0.0 /100 | #304 | Tragic 16.4% |
| Immigrants | Morocco | 0.0 /100 | #305 | Tragic 16.3% |
| Somalis | 0.0 /100 | #306 | Tragic 16.2% |
| Immigrants | Ghana | 0.0 /100 | #307 | Tragic 16.2% |
| Houma | 0.0 /100 | #308 | Tragic 16.1% |
| Immigrants | Somalia | 0.0 /100 | #309 | Tragic 15.9% |
| Moroccans | 0.0 /100 | #310 | Tragic 15.9% |
| Albanians | 0.0 /100 | #311 | Tragic 15.8% |
| Puerto Ricans | 0.0 /100 | #312 | Tragic 15.6% |
Demographics Similar to Immigrants from Ethiopia by 3 or more Vehicles in Household
In terms of 3 or more vehicles in household, the demographic groups most similar to Immigrants from Ethiopia are Ethiopian (17.9%, a difference of 0.0%), Immigrants from Turkey (17.9%, a difference of 0.030%), Subsaharan African (17.9%, a difference of 0.19%), Immigrants from Southern Europe (17.9%, a difference of 0.21%), and Immigrants from Eritrea (17.8%, a difference of 0.23%).
| Demographics | Rating | Rank | 3 or more Vehicles in Household |
| Immigrants | Australia | 2.0 /100 | #246 | Tragic 18.1% |
| Carpatho Rusyns | 1.9 /100 | #247 | Tragic 18.0% |
| Immigrants | Eastern Africa | 1.8 /100 | #248 | Tragic 18.0% |
| Immigrants | Saudi Arabia | 1.7 /100 | #249 | Tragic 18.0% |
| Venezuelans | 1.7 /100 | #250 | Tragic 18.0% |
| Alsatians | 1.5 /100 | #251 | Tragic 18.0% |
| Immigrants | Southern Europe | 1.4 /100 | #252 | Tragic 17.9% |
| Immigrants | Ethiopia | 1.3 /100 | #253 | Tragic 17.9% |
| Ethiopians | 1.2 /100 | #254 | Tragic 17.9% |
| Immigrants | Turkey | 1.2 /100 | #255 | Tragic 17.9% |
| Sub-Saharan Africans | 1.1 /100 | #256 | Tragic 17.9% |
| Immigrants | Eritrea | 1.1 /100 | #257 | Tragic 17.8% |
| Sudanese | 1.1 /100 | #258 | Tragic 17.8% |
| Uruguayans | 1.0 /100 | #259 | Tragic 17.8% |
| Ugandans | 0.9 /100 | #260 | Tragic 17.8% |