Lebanese vs Macedonian 3 or more Vehicles in Household
COMPARE
Lebanese
Macedonian
3 or more Vehicles in Household
3 or more Vehicles in Household Comparison
Lebanese
Macedonians
20.0%
3 OR MORE VEHICLES IN HOUSEHOLD
79.8/ 100
METRIC RATING
152nd/ 347
METRIC RANK
17.7%
3 OR MORE VEHICLES IN HOUSEHOLD
0.8/ 100
METRIC RATING
266th/ 347
METRIC RANK
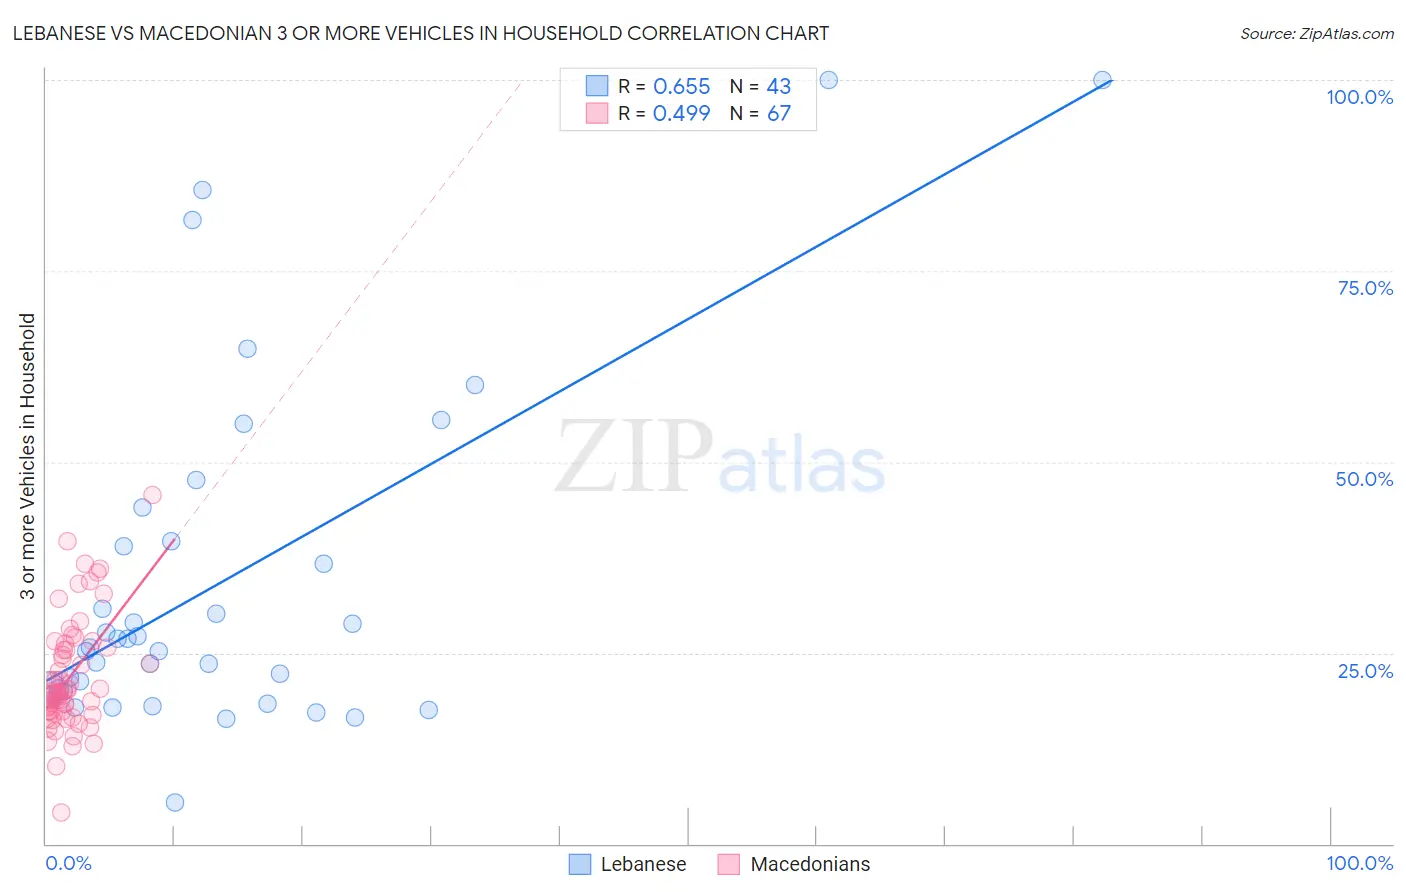
Lebanese vs Macedonian 3 or more Vehicles in Household Correlation Chart
The statistical analysis conducted on geographies consisting of 401,196,452 people shows a significant positive correlation between the proportion of Lebanese and percentage of households with 3 or more vehicles available in the United States with a correlation coefficient (R) of 0.655 and weighted average of 20.0%. Similarly, the statistical analysis conducted on geographies consisting of 132,563,114 people shows a moderate positive correlation between the proportion of Macedonians and percentage of households with 3 or more vehicles available in the United States with a correlation coefficient (R) of 0.499 and weighted average of 17.7%, a difference of 12.9%.
3 or more Vehicles in Household Correlation Summary
| Measurement | Lebanese | Macedonian |
| Minimum | 5.4% | 4.0% |
| Maximum | 100.0% | 45.7% |
| Range | 94.6% | 41.6% |
| Mean | 34.3% | 21.8% |
| Median | 25.8% | 19.9% |
| Interquartile 25% (IQ1) | 20.0% | 17.3% |
| Interquartile 75% (IQ3) | 39.6% | 25.7% |
| Interquartile Range (IQR) | 19.7% | 8.4% |
| Standard Deviation (Sample) | 22.7% | 7.4% |
| Standard Deviation (Population) | 22.4% | 7.3% |
Similar Demographics by 3 or more Vehicles in Household
Demographics Similar to Lebanese by 3 or more Vehicles in Household
In terms of 3 or more vehicles in household, the demographic groups most similar to Lebanese are Taiwanese (20.0%, a difference of 0.10%), Immigrants (20.0%, a difference of 0.12%), Immigrants from Iran (20.0%, a difference of 0.13%), Guatemalan (20.1%, a difference of 0.34%), and Slovak (20.1%, a difference of 0.39%).
| Demographics | Rating | Rank | 3 or more Vehicles in Household |
| Palestinians | 83.9 /100 | #145 | Excellent 20.1% |
| Australians | 83.6 /100 | #146 | Excellent 20.1% |
| Slovaks | 83.0 /100 | #147 | Excellent 20.1% |
| Guatemalans | 82.6 /100 | #148 | Excellent 20.1% |
| Immigrants | Iran | 80.9 /100 | #149 | Excellent 20.0% |
| Immigrants | Immigrants | 80.8 /100 | #150 | Excellent 20.0% |
| Taiwanese | 80.6 /100 | #151 | Excellent 20.0% |
| Lebanese | 79.8 /100 | #152 | Good 20.0% |
| Yuman | 75.6 /100 | #153 | Good 19.9% |
| Immigrants | Jordan | 75.0 /100 | #154 | Good 19.9% |
| Tlingit-Haida | 73.4 /100 | #155 | Good 19.9% |
| Thais | 71.1 /100 | #156 | Good 19.8% |
| Hungarians | 70.5 /100 | #157 | Good 19.8% |
| Armenians | 68.8 /100 | #158 | Good 19.8% |
| Immigrants | Pakistan | 68.2 /100 | #159 | Good 19.8% |
Demographics Similar to Macedonians by 3 or more Vehicles in Household
In terms of 3 or more vehicles in household, the demographic groups most similar to Macedonians are Immigrants from Panama (17.7%, a difference of 0.020%), Immigrants from Venezuela (17.7%, a difference of 0.050%), Immigrants from Bulgaria (17.7%, a difference of 0.070%), Cambodian (17.8%, a difference of 0.16%), and Bermudan (17.8%, a difference of 0.19%).
| Demographics | Rating | Rank | 3 or more Vehicles in Household |
| Uruguayans | 1.0 /100 | #259 | Tragic 17.8% |
| Ugandans | 0.9 /100 | #260 | Tragic 17.8% |
| Immigrants | Northern Africa | 0.9 /100 | #261 | Tragic 17.8% |
| Colombians | 0.9 /100 | #262 | Tragic 17.8% |
| Bermudans | 0.9 /100 | #263 | Tragic 17.8% |
| Cambodians | 0.9 /100 | #264 | Tragic 17.8% |
| Immigrants | Panama | 0.8 /100 | #265 | Tragic 17.7% |
| Macedonians | 0.8 /100 | #266 | Tragic 17.7% |
| Immigrants | Venezuela | 0.8 /100 | #267 | Tragic 17.7% |
| Immigrants | Bulgaria | 0.8 /100 | #268 | Tragic 17.7% |
| Immigrants | France | 0.6 /100 | #269 | Tragic 17.6% |
| Immigrants | Nepal | 0.6 /100 | #270 | Tragic 17.6% |
| South Americans | 0.6 /100 | #271 | Tragic 17.6% |
| Immigrants | Africa | 0.5 /100 | #272 | Tragic 17.6% |
| Immigrants | Sudan | 0.5 /100 | #273 | Tragic 17.6% |