Lebanese vs Immigrants from Ireland 3 or more Vehicles in Household
COMPARE
Lebanese
Immigrants from Ireland
3 or more Vehicles in Household
3 or more Vehicles in Household Comparison
Lebanese
Immigrants from Ireland
20.0%
3 OR MORE VEHICLES IN HOUSEHOLD
79.8/ 100
METRIC RATING
152nd/ 347
METRIC RANK
17.3%
3 OR MORE VEHICLES IN HOUSEHOLD
0.3/ 100
METRIC RATING
282nd/ 347
METRIC RANK
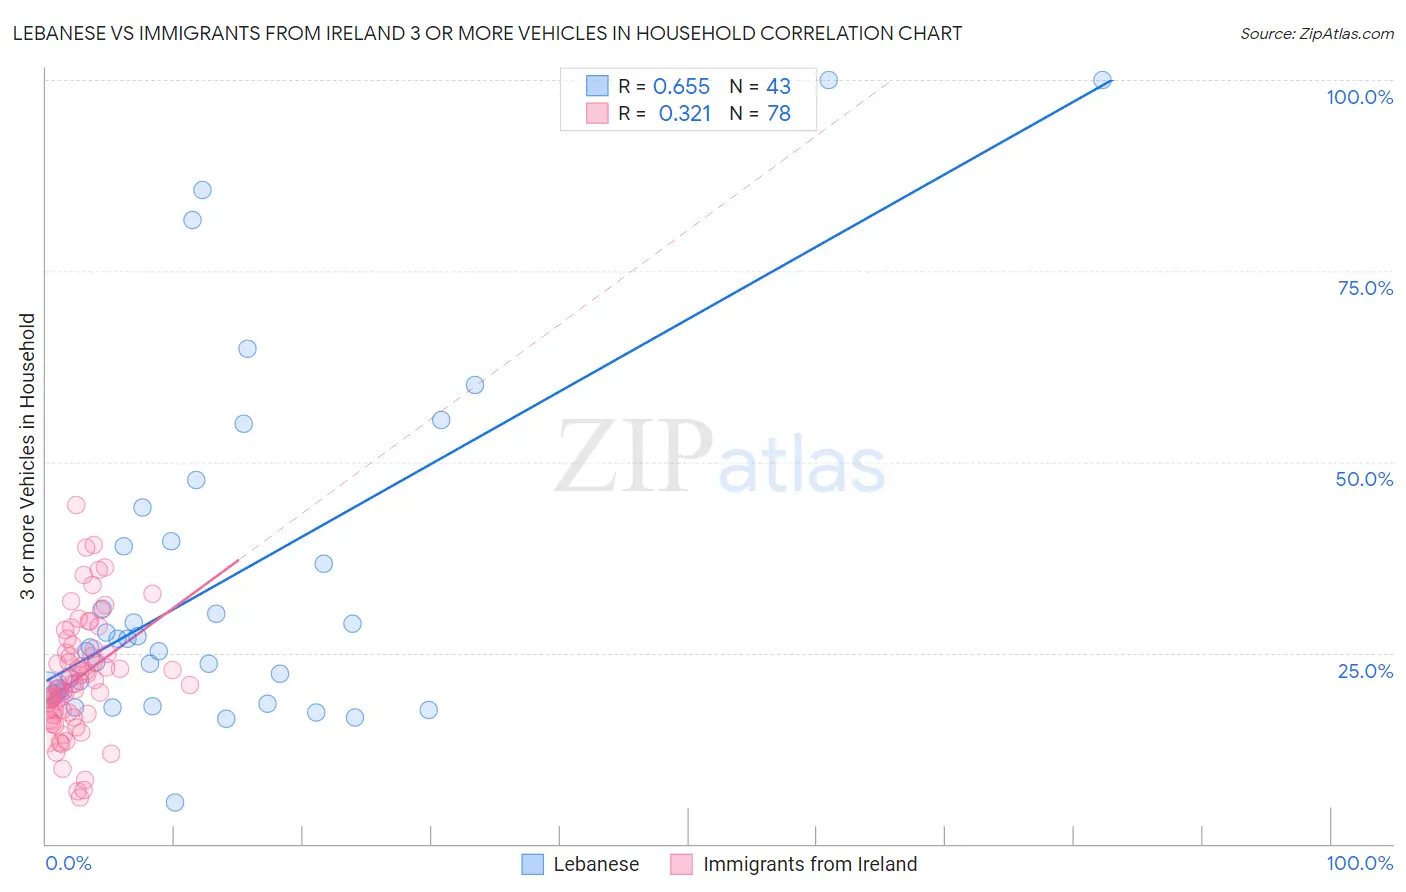
Lebanese vs Immigrants from Ireland 3 or more Vehicles in Household Correlation Chart
The statistical analysis conducted on geographies consisting of 401,196,452 people shows a significant positive correlation between the proportion of Lebanese and percentage of households with 3 or more vehicles available in the United States with a correlation coefficient (R) of 0.655 and weighted average of 20.0%. Similarly, the statistical analysis conducted on geographies consisting of 240,727,635 people shows a mild positive correlation between the proportion of Immigrants from Ireland and percentage of households with 3 or more vehicles available in the United States with a correlation coefficient (R) of 0.321 and weighted average of 17.3%, a difference of 15.4%.
3 or more Vehicles in Household Correlation Summary
| Measurement | Lebanese | Immigrants from Ireland |
| Minimum | 5.4% | 6.0% |
| Maximum | 100.0% | 44.3% |
| Range | 94.6% | 38.3% |
| Mean | 34.3% | 21.7% |
| Median | 25.8% | 20.9% |
| Interquartile 25% (IQ1) | 20.0% | 16.8% |
| Interquartile 75% (IQ3) | 39.6% | 25.6% |
| Interquartile Range (IQR) | 19.7% | 8.8% |
| Standard Deviation (Sample) | 22.7% | 7.8% |
| Standard Deviation (Population) | 22.4% | 7.7% |
Similar Demographics by 3 or more Vehicles in Household
Demographics Similar to Lebanese by 3 or more Vehicles in Household
In terms of 3 or more vehicles in household, the demographic groups most similar to Lebanese are Taiwanese (20.0%, a difference of 0.10%), Immigrants (20.0%, a difference of 0.12%), Immigrants from Iran (20.0%, a difference of 0.13%), Guatemalan (20.1%, a difference of 0.34%), and Slovak (20.1%, a difference of 0.39%).
| Demographics | Rating | Rank | 3 or more Vehicles in Household |
| Palestinians | 83.9 /100 | #145 | Excellent 20.1% |
| Australians | 83.6 /100 | #146 | Excellent 20.1% |
| Slovaks | 83.0 /100 | #147 | Excellent 20.1% |
| Guatemalans | 82.6 /100 | #148 | Excellent 20.1% |
| Immigrants | Iran | 80.9 /100 | #149 | Excellent 20.0% |
| Immigrants | Immigrants | 80.8 /100 | #150 | Excellent 20.0% |
| Taiwanese | 80.6 /100 | #151 | Excellent 20.0% |
| Lebanese | 79.8 /100 | #152 | Good 20.0% |
| Yuman | 75.6 /100 | #153 | Good 19.9% |
| Immigrants | Jordan | 75.0 /100 | #154 | Good 19.9% |
| Tlingit-Haida | 73.4 /100 | #155 | Good 19.9% |
| Thais | 71.1 /100 | #156 | Good 19.8% |
| Hungarians | 70.5 /100 | #157 | Good 19.8% |
| Armenians | 68.8 /100 | #158 | Good 19.8% |
| Immigrants | Pakistan | 68.2 /100 | #159 | Good 19.8% |
Demographics Similar to Immigrants from Ireland by 3 or more Vehicles in Household
In terms of 3 or more vehicles in household, the demographic groups most similar to Immigrants from Ireland are Black/African American (17.3%, a difference of 0.050%), Immigrants from Colombia (17.3%, a difference of 0.17%), Immigrants from Latvia (17.4%, a difference of 0.29%), Immigrants from Eastern Europe (17.4%, a difference of 0.33%), and Immigrants from Kazakhstan (17.4%, a difference of 0.37%).
| Demographics | Rating | Rank | 3 or more Vehicles in Household |
| Immigrants | Ukraine | 0.4 /100 | #275 | Tragic 17.5% |
| Okinawans | 0.4 /100 | #276 | Tragic 17.4% |
| Brazilians | 0.4 /100 | #277 | Tragic 17.4% |
| Immigrants | Bahamas | 0.3 /100 | #278 | Tragic 17.4% |
| Immigrants | Kazakhstan | 0.3 /100 | #279 | Tragic 17.4% |
| Immigrants | Eastern Europe | 0.3 /100 | #280 | Tragic 17.4% |
| Immigrants | Latvia | 0.3 /100 | #281 | Tragic 17.4% |
| Immigrants | Ireland | 0.3 /100 | #282 | Tragic 17.3% |
| Blacks/African Americans | 0.3 /100 | #283 | Tragic 17.3% |
| Immigrants | Colombia | 0.3 /100 | #284 | Tragic 17.3% |
| Immigrants | Croatia | 0.2 /100 | #285 | Tragic 17.2% |
| Menominee | 0.2 /100 | #286 | Tragic 17.2% |
| Immigrants | Brazil | 0.2 /100 | #287 | Tragic 17.1% |
| Immigrants | Uruguay | 0.2 /100 | #288 | Tragic 17.1% |
| Immigrants | Liberia | 0.1 /100 | #289 | Tragic 17.1% |