Lebanese vs Filipino 12th Grade, No Diploma
COMPARE
Lebanese
Filipino
12th Grade, No Diploma
12th Grade, No Diploma Comparison
Lebanese
Filipinos
92.2%
12TH GRADE, NO DIPLOMA
97.6/ 100
METRIC RATING
104th/ 347
METRIC RANK
93.2%
12TH GRADE, NO DIPLOMA
99.9/ 100
METRIC RATING
20th/ 347
METRIC RANK
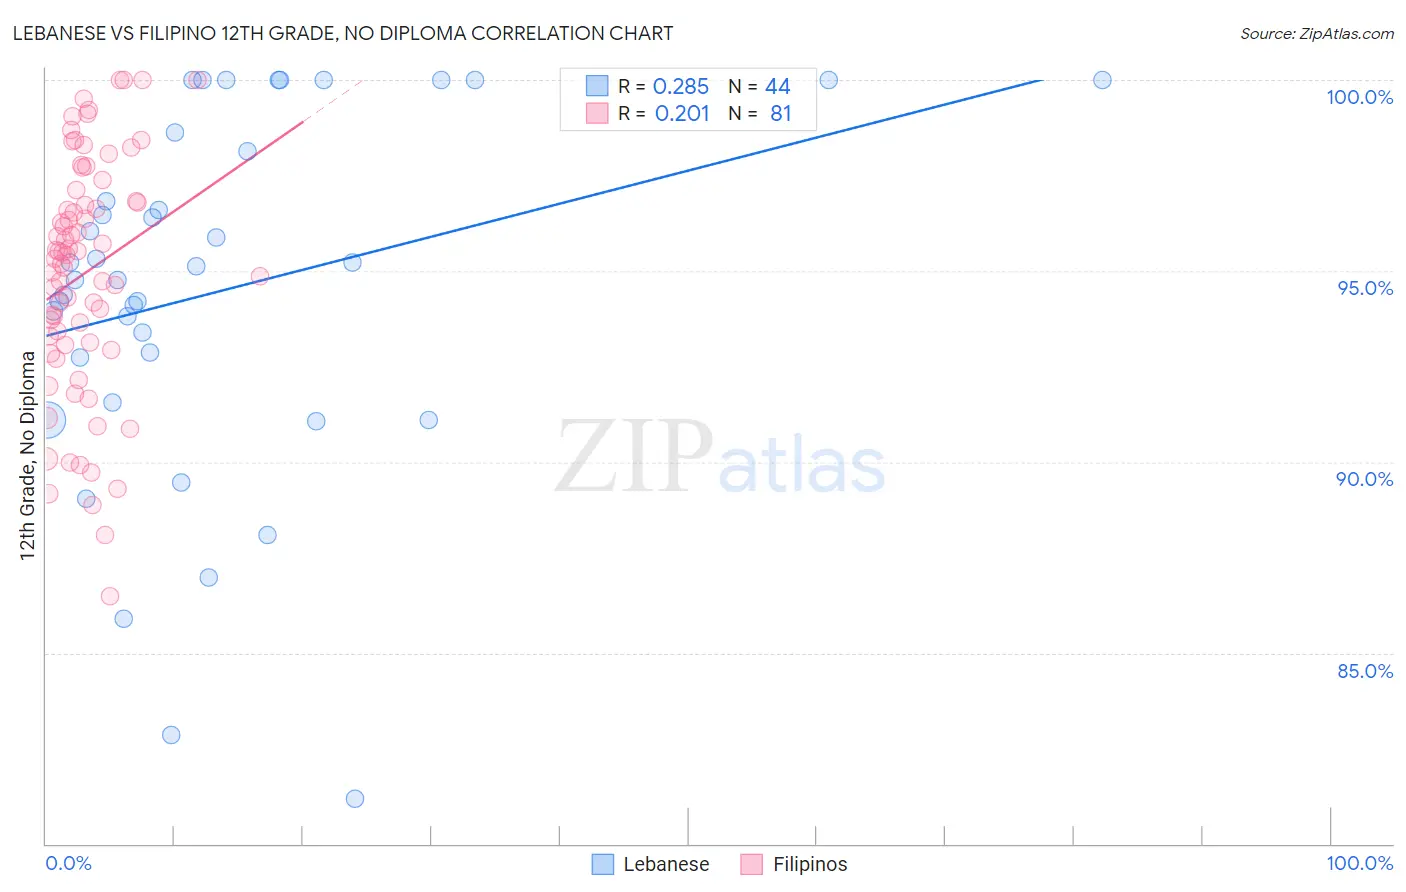
Lebanese vs Filipino 12th Grade, No Diploma Correlation Chart
The statistical analysis conducted on geographies consisting of 401,624,157 people shows a weak positive correlation between the proportion of Lebanese and percentage of population with at least 12th grade (no diploma) education in the United States with a correlation coefficient (R) of 0.285 and weighted average of 92.2%. Similarly, the statistical analysis conducted on geographies consisting of 254,351,912 people shows a weak positive correlation between the proportion of Filipinos and percentage of population with at least 12th grade (no diploma) education in the United States with a correlation coefficient (R) of 0.201 and weighted average of 93.2%, a difference of 1.1%.
12th Grade, No Diploma Correlation Summary
| Measurement | Lebanese | Filipino |
| Minimum | 81.2% | 86.5% |
| Maximum | 100.0% | 100.0% |
| Range | 18.8% | 13.5% |
| Mean | 94.5% | 94.9% |
| Median | 95.0% | 95.4% |
| Interquartile 25% (IQ1) | 92.1% | 93.1% |
| Interquartile 75% (IQ3) | 98.4% | 97.0% |
| Interquartile Range (IQR) | 6.3% | 3.9% |
| Standard Deviation (Sample) | 4.7% | 3.1% |
| Standard Deviation (Population) | 4.6% | 3.1% |
Similar Demographics by 12th Grade, No Diploma
Demographics Similar to Lebanese by 12th Grade, No Diploma
In terms of 12th grade, no diploma, the demographic groups most similar to Lebanese are Immigrants from Belarus (92.2%, a difference of 0.020%), Immigrants from Russia (92.2%, a difference of 0.030%), Syrian (92.2%, a difference of 0.040%), Jordanian (92.2%, a difference of 0.040%), and Immigrants from Hungary (92.1%, a difference of 0.060%).
| Demographics | Rating | Rank | 12th Grade, No Diploma |
| Celtics | 98.4 /100 | #97 | Exceptional 92.3% |
| Immigrants | Kuwait | 98.4 /100 | #98 | Exceptional 92.3% |
| Immigrants | Korea | 98.3 /100 | #99 | Exceptional 92.3% |
| Immigrants | Croatia | 98.3 /100 | #100 | Exceptional 92.3% |
| Swiss | 98.1 /100 | #101 | Exceptional 92.3% |
| Alaskan Athabascans | 98.1 /100 | #102 | Exceptional 92.3% |
| Immigrants | Norway | 98.1 /100 | #103 | Exceptional 92.3% |
| Lebanese | 97.6 /100 | #104 | Exceptional 92.2% |
| Immigrants | Belarus | 97.4 /100 | #105 | Exceptional 92.2% |
| Immigrants | Russia | 97.3 /100 | #106 | Exceptional 92.2% |
| Syrians | 97.2 /100 | #107 | Exceptional 92.2% |
| Jordanians | 97.2 /100 | #108 | Exceptional 92.2% |
| Immigrants | Hungary | 97.0 /100 | #109 | Exceptional 92.1% |
| Palestinians | 97.0 /100 | #110 | Exceptional 92.1% |
| Immigrants | Greece | 96.9 /100 | #111 | Exceptional 92.1% |
Demographics Similar to Filipinos by 12th Grade, No Diploma
In terms of 12th grade, no diploma, the demographic groups most similar to Filipinos are Italian (93.2%, a difference of 0.020%), German (93.3%, a difference of 0.030%), Estonian (93.2%, a difference of 0.030%), Scandinavian (93.2%, a difference of 0.040%), and Immigrants from Singapore (93.3%, a difference of 0.050%).
| Demographics | Rating | Rank | 12th Grade, No Diploma |
| Danes | 100.0 /100 | #13 | Exceptional 93.5% |
| Bulgarians | 100.0 /100 | #14 | Exceptional 93.5% |
| Finns | 100.0 /100 | #15 | Exceptional 93.4% |
| Maltese | 100.0 /100 | #16 | Exceptional 93.3% |
| Luxembourgers | 100.0 /100 | #17 | Exceptional 93.3% |
| Immigrants | Singapore | 99.9 /100 | #18 | Exceptional 93.3% |
| Germans | 99.9 /100 | #19 | Exceptional 93.3% |
| Filipinos | 99.9 /100 | #20 | Exceptional 93.2% |
| Italians | 99.9 /100 | #21 | Exceptional 93.2% |
| Estonians | 99.9 /100 | #22 | Exceptional 93.2% |
| Scandinavians | 99.9 /100 | #23 | Exceptional 93.2% |
| Thais | 99.9 /100 | #24 | Exceptional 93.2% |
| Czechs | 99.9 /100 | #25 | Exceptional 93.2% |
| Russians | 99.9 /100 | #26 | Exceptional 93.2% |
| Cypriots | 99.9 /100 | #27 | Exceptional 93.1% |