Kiowa vs Immigrants from Peru Receiving Food Stamps
COMPARE
Kiowa
Immigrants from Peru
Receiving Food Stamps
Receiving Food Stamps Comparison
Kiowa
Immigrants from Peru
14.9%
RECEIVING FOOD STAMPS
0.0/ 100
METRIC RATING
279th/ 347
METRIC RANK
12.0%
RECEIVING FOOD STAMPS
32.2/ 100
METRIC RATING
190th/ 347
METRIC RANK
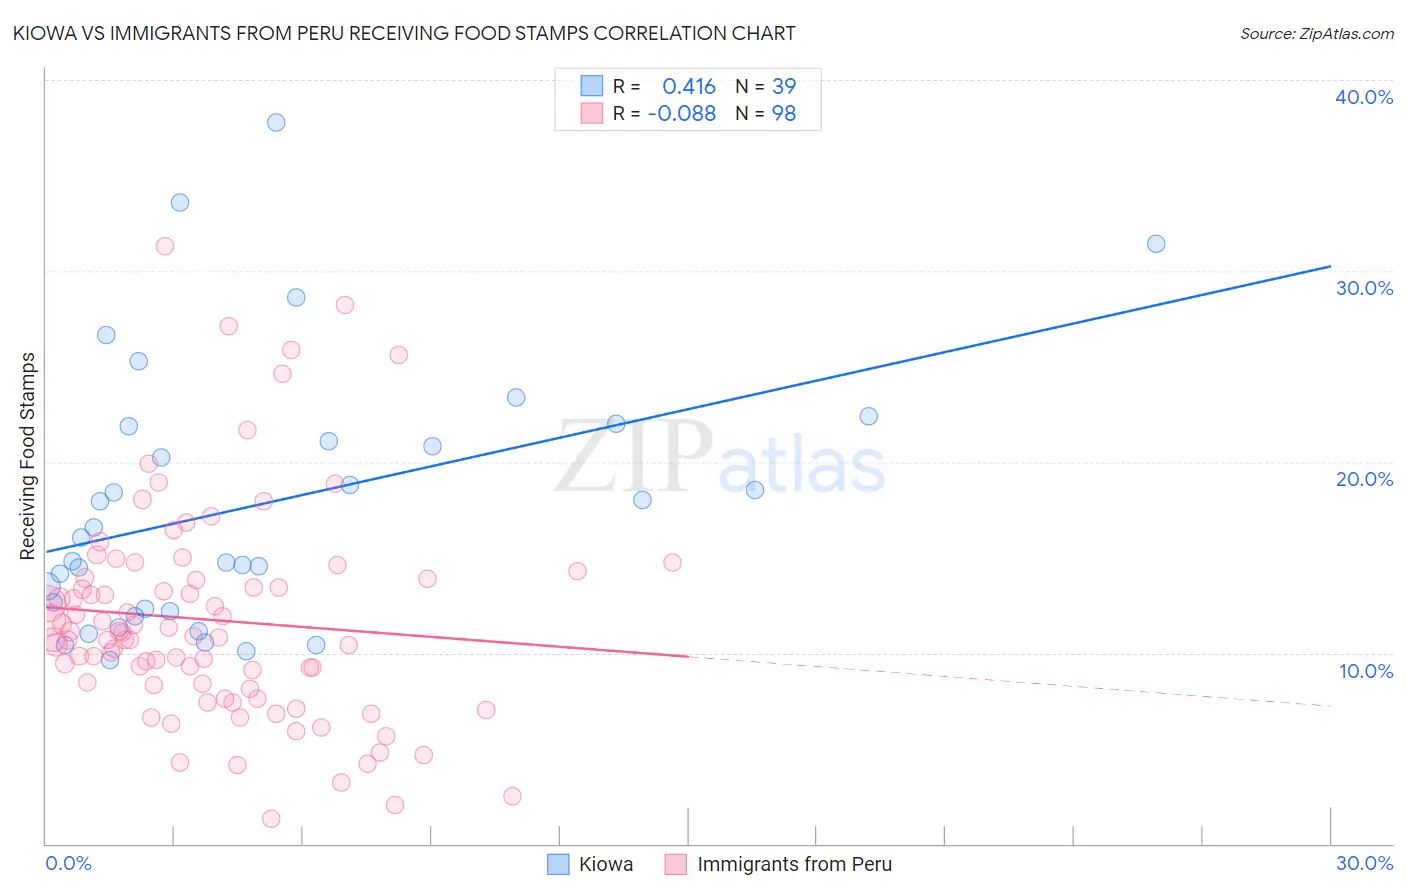
Kiowa vs Immigrants from Peru Receiving Food Stamps Correlation Chart
The statistical analysis conducted on geographies consisting of 56,088,219 people shows a moderate positive correlation between the proportion of Kiowa and percentage of population receiving government assistance and/or food stamps in the United States with a correlation coefficient (R) of 0.416 and weighted average of 14.9%. Similarly, the statistical analysis conducted on geographies consisting of 328,237,841 people shows a slight negative correlation between the proportion of Immigrants from Peru and percentage of population receiving government assistance and/or food stamps in the United States with a correlation coefficient (R) of -0.088 and weighted average of 12.0%, a difference of 23.4%.
Receiving Food Stamps Correlation Summary
| Measurement | Kiowa | Immigrants from Peru |
| Minimum | 9.6% | 1.3% |
| Maximum | 37.8% | 31.3% |
| Range | 28.2% | 30.0% |
| Mean | 17.8% | 11.7% |
| Median | 16.0% | 10.8% |
| Interquartile 25% (IQ1) | 12.2% | 8.3% |
| Interquartile 75% (IQ3) | 21.9% | 13.9% |
| Interquartile Range (IQR) | 9.7% | 5.6% |
| Standard Deviation (Sample) | 6.9% | 5.6% |
| Standard Deviation (Population) | 6.9% | 5.6% |
Similar Demographics by Receiving Food Stamps
Demographics Similar to Kiowa by Receiving Food Stamps
In terms of receiving food stamps, the demographic groups most similar to Kiowa are Ecuadorian (14.9%, a difference of 0.050%), Belizean (14.8%, a difference of 0.27%), Spanish American Indian (14.9%, a difference of 0.37%), Seminole (14.8%, a difference of 0.40%), and Liberian (14.8%, a difference of 0.45%).
| Demographics | Rating | Rank | Receiving Food Stamps |
| Chippewa | 0.1 /100 | #272 | Tragic 14.7% |
| Alaskan Athabascans | 0.1 /100 | #273 | Tragic 14.7% |
| Immigrants | Western Africa | 0.1 /100 | #274 | Tragic 14.7% |
| Ute | 0.1 /100 | #275 | Tragic 14.7% |
| Liberians | 0.1 /100 | #276 | Tragic 14.8% |
| Seminole | 0.1 /100 | #277 | Tragic 14.8% |
| Belizeans | 0.1 /100 | #278 | Tragic 14.8% |
| Kiowa | 0.0 /100 | #279 | Tragic 14.9% |
| Ecuadorians | 0.0 /100 | #280 | Tragic 14.9% |
| Spanish American Indians | 0.0 /100 | #281 | Tragic 14.9% |
| Immigrants | Central America | 0.0 /100 | #282 | Tragic 15.0% |
| Bangladeshis | 0.0 /100 | #283 | Tragic 15.0% |
| Immigrants | Ecuador | 0.0 /100 | #284 | Tragic 15.0% |
| Immigrants | Liberia | 0.0 /100 | #285 | Tragic 15.1% |
| Africans | 0.0 /100 | #286 | Tragic 15.1% |
Demographics Similar to Immigrants from Peru by Receiving Food Stamps
In terms of receiving food stamps, the demographic groups most similar to Immigrants from Peru are Venezuelan (12.0%, a difference of 0.010%), Immigrants from Cameroon (12.0%, a difference of 0.060%), Samoan (12.1%, a difference of 0.19%), Sudanese (12.0%, a difference of 0.20%), and Albanian (12.0%, a difference of 0.50%).
| Demographics | Rating | Rank | Receiving Food Stamps |
| Immigrants | Uganda | 40.3 /100 | #183 | Average 11.9% |
| Spaniards | 39.8 /100 | #184 | Fair 11.9% |
| Immigrants | Iraq | 37.1 /100 | #185 | Fair 12.0% |
| Spanish | 36.9 /100 | #186 | Fair 12.0% |
| Albanians | 35.4 /100 | #187 | Fair 12.0% |
| Sudanese | 33.4 /100 | #188 | Fair 12.0% |
| Immigrants | Cameroon | 32.5 /100 | #189 | Fair 12.0% |
| Immigrants | Peru | 32.2 /100 | #190 | Fair 12.0% |
| Venezuelans | 32.1 /100 | #191 | Fair 12.0% |
| Samoans | 31.0 /100 | #192 | Fair 12.1% |
| Immigrants | Fiji | 27.8 /100 | #193 | Fair 12.1% |
| Immigrants | Sudan | 27.1 /100 | #194 | Fair 12.1% |
| Americans | 26.7 /100 | #195 | Fair 12.2% |
| Iraqis | 26.6 /100 | #196 | Fair 12.2% |
| Delaware | 26.1 /100 | #197 | Fair 12.2% |