Kiowa vs Pima 4 or more Vehicles in Household
COMPARE
Kiowa
Pima
4 or more Vehicles in Household
4 or more Vehicles in Household Comparison
Kiowa
Pima
6.2%
4 OR MORE VEHICLES IN HOUSEHOLD
34.7/ 100
METRIC RATING
188th/ 347
METRIC RANK
7.9%
4 OR MORE VEHICLES IN HOUSEHOLD
100.0/ 100
METRIC RATING
41st/ 347
METRIC RANK
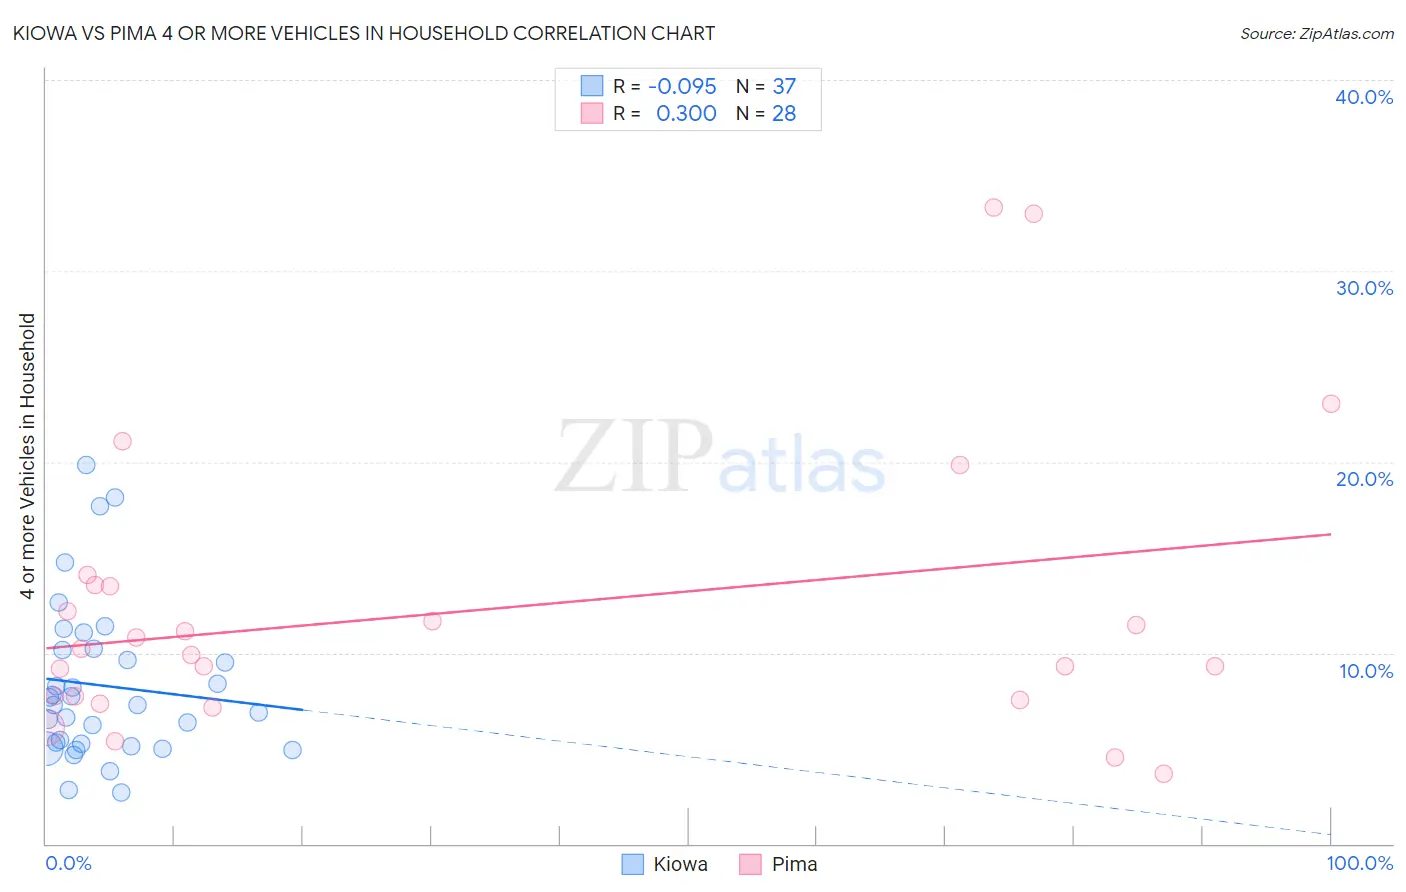
Kiowa vs Pima 4 or more Vehicles in Household Correlation Chart
The statistical analysis conducted on geographies consisting of 56,082,422 people shows a slight negative correlation between the proportion of Kiowa and percentage of households with 4 or more vehicles available in the United States with a correlation coefficient (R) of -0.095 and weighted average of 6.2%. Similarly, the statistical analysis conducted on geographies consisting of 61,524,905 people shows a weak positive correlation between the proportion of Pima and percentage of households with 4 or more vehicles available in the United States with a correlation coefficient (R) of 0.300 and weighted average of 7.9%, a difference of 26.4%.
4 or more Vehicles in Household Correlation Summary
| Measurement | Kiowa | Pima |
| Minimum | 2.7% | 3.7% |
| Maximum | 19.9% | 33.3% |
| Range | 17.2% | 29.7% |
| Mean | 8.3% | 12.2% |
| Median | 7.3% | 10.0% |
| Interquartile 25% (IQ1) | 5.2% | 7.6% |
| Interquartile 75% (IQ3) | 10.2% | 13.5% |
| Interquartile Range (IQR) | 5.0% | 5.9% |
| Standard Deviation (Sample) | 4.1% | 7.5% |
| Standard Deviation (Population) | 4.1% | 7.4% |
Similar Demographics by 4 or more Vehicles in Household
Demographics Similar to Kiowa by 4 or more Vehicles in Household
In terms of 4 or more vehicles in household, the demographic groups most similar to Kiowa are Immigrants from South Africa (6.2%, a difference of 0.070%), Immigrants from Eastern Asia (6.2%, a difference of 0.17%), Immigrants from Northern Europe (6.2%, a difference of 0.23%), Thai (6.2%, a difference of 0.25%), and Iraqi (6.2%, a difference of 0.29%).
| Demographics | Rating | Rank | 4 or more Vehicles in Household |
| Yugoslavians | 41.1 /100 | #181 | Average 6.3% |
| South American Indians | 40.7 /100 | #182 | Average 6.3% |
| Immigrants | Burma/Myanmar | 37.5 /100 | #183 | Fair 6.2% |
| Iraqis | 37.3 /100 | #184 | Fair 6.2% |
| Thais | 36.9 /100 | #185 | Fair 6.2% |
| Immigrants | Northern Europe | 36.8 /100 | #186 | Fair 6.2% |
| Immigrants | South Africa | 35.4 /100 | #187 | Fair 6.2% |
| Kiowa | 34.7 /100 | #188 | Fair 6.2% |
| Immigrants | Eastern Asia | 33.3 /100 | #189 | Fair 6.2% |
| South Africans | 32.2 /100 | #190 | Fair 6.2% |
| Inupiat | 30.7 /100 | #191 | Fair 6.2% |
| Romanians | 30.7 /100 | #192 | Fair 6.2% |
| Immigrants | Kuwait | 28.0 /100 | #193 | Fair 6.2% |
| Immigrants | Sweden | 27.0 /100 | #194 | Fair 6.2% |
| Argentineans | 27.0 /100 | #195 | Fair 6.2% |
Demographics Similar to Pima by 4 or more Vehicles in Household
In terms of 4 or more vehicles in household, the demographic groups most similar to Pima are Salvadoran (7.8%, a difference of 0.49%), Spanish (7.9%, a difference of 0.57%), Fijian (7.8%, a difference of 0.60%), Bhutanese (7.8%, a difference of 0.86%), and Choctaw (7.8%, a difference of 0.92%).
| Demographics | Rating | Rank | 4 or more Vehicles in Household |
| Alaskan Athabascans | 100.0 /100 | #34 | Exceptional 8.1% |
| Guamanians/Chamorros | 100.0 /100 | #35 | Exceptional 8.1% |
| Norwegians | 100.0 /100 | #36 | Exceptional 8.0% |
| Scandinavians | 100.0 /100 | #37 | Exceptional 8.0% |
| Sioux | 100.0 /100 | #38 | Exceptional 8.0% |
| Spanish Americans | 100.0 /100 | #39 | Exceptional 8.0% |
| Spanish | 100.0 /100 | #40 | Exceptional 7.9% |
| Pima | 100.0 /100 | #41 | Exceptional 7.9% |
| Salvadorans | 100.0 /100 | #42 | Exceptional 7.8% |
| Fijians | 100.0 /100 | #43 | Exceptional 7.8% |
| Bhutanese | 100.0 /100 | #44 | Exceptional 7.8% |
| Choctaw | 100.0 /100 | #45 | Exceptional 7.8% |
| Crow | 100.0 /100 | #46 | Exceptional 7.8% |
| Osage | 100.0 /100 | #47 | Exceptional 7.8% |
| Swiss | 100.0 /100 | #48 | Exceptional 7.8% |