Kiowa vs Ottawa 4 or more Vehicles in Household
COMPARE
Kiowa
Ottawa
4 or more Vehicles in Household
4 or more Vehicles in Household Comparison
Kiowa
Ottawa
6.2%
4 OR MORE VEHICLES IN HOUSEHOLD
34.7/ 100
METRIC RATING
188th/ 347
METRIC RANK
6.6%
4 OR MORE VEHICLES IN HOUSEHOLD
86.9/ 100
METRIC RATING
134th/ 347
METRIC RANK
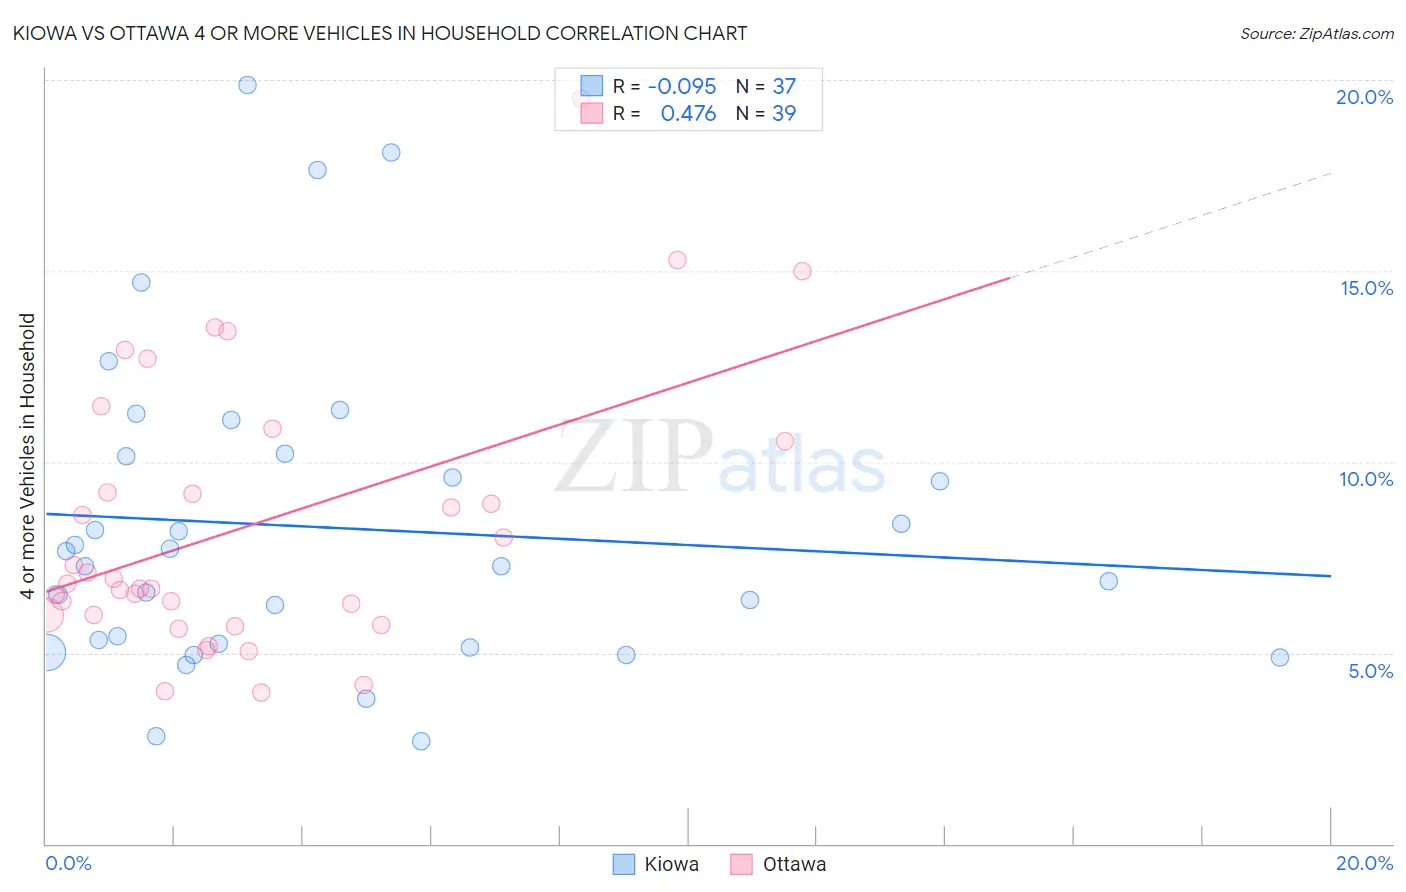
Kiowa vs Ottawa 4 or more Vehicles in Household Correlation Chart
The statistical analysis conducted on geographies consisting of 56,082,422 people shows a slight negative correlation between the proportion of Kiowa and percentage of households with 4 or more vehicles available in the United States with a correlation coefficient (R) of -0.095 and weighted average of 6.2%. Similarly, the statistical analysis conducted on geographies consisting of 49,927,174 people shows a moderate positive correlation between the proportion of Ottawa and percentage of households with 4 or more vehicles available in the United States with a correlation coefficient (R) of 0.476 and weighted average of 6.6%, a difference of 6.5%.
4 or more Vehicles in Household Correlation Summary
| Measurement | Kiowa | Ottawa |
| Minimum | 2.7% | 4.0% |
| Maximum | 19.9% | 19.5% |
| Range | 17.2% | 15.6% |
| Mean | 8.3% | 8.3% |
| Median | 7.3% | 6.8% |
| Interquartile 25% (IQ1) | 5.2% | 6.0% |
| Interquartile 75% (IQ3) | 10.2% | 10.5% |
| Interquartile Range (IQR) | 5.0% | 4.5% |
| Standard Deviation (Sample) | 4.1% | 3.6% |
| Standard Deviation (Population) | 4.1% | 3.5% |
Similar Demographics by 4 or more Vehicles in Household
Demographics Similar to Kiowa by 4 or more Vehicles in Household
In terms of 4 or more vehicles in household, the demographic groups most similar to Kiowa are Immigrants from South Africa (6.2%, a difference of 0.070%), Immigrants from Eastern Asia (6.2%, a difference of 0.17%), Immigrants from Northern Europe (6.2%, a difference of 0.23%), Thai (6.2%, a difference of 0.25%), and Iraqi (6.2%, a difference of 0.29%).
| Demographics | Rating | Rank | 4 or more Vehicles in Household |
| Yugoslavians | 41.1 /100 | #181 | Average 6.3% |
| South American Indians | 40.7 /100 | #182 | Average 6.3% |
| Immigrants | Burma/Myanmar | 37.5 /100 | #183 | Fair 6.2% |
| Iraqis | 37.3 /100 | #184 | Fair 6.2% |
| Thais | 36.9 /100 | #185 | Fair 6.2% |
| Immigrants | Northern Europe | 36.8 /100 | #186 | Fair 6.2% |
| Immigrants | South Africa | 35.4 /100 | #187 | Fair 6.2% |
| Kiowa | 34.7 /100 | #188 | Fair 6.2% |
| Immigrants | Eastern Asia | 33.3 /100 | #189 | Fair 6.2% |
| South Africans | 32.2 /100 | #190 | Fair 6.2% |
| Inupiat | 30.7 /100 | #191 | Fair 6.2% |
| Romanians | 30.7 /100 | #192 | Fair 6.2% |
| Immigrants | Kuwait | 28.0 /100 | #193 | Fair 6.2% |
| Immigrants | Sweden | 27.0 /100 | #194 | Fair 6.2% |
| Argentineans | 27.0 /100 | #195 | Fair 6.2% |
Demographics Similar to Ottawa by 4 or more Vehicles in Household
In terms of 4 or more vehicles in household, the demographic groups most similar to Ottawa are Armenian (6.6%, a difference of 0.020%), Tohono O'odham (6.6%, a difference of 0.030%), Luxembourger (6.6%, a difference of 0.10%), Immigrants from Netherlands (6.6%, a difference of 0.21%), and French Canadian (6.6%, a difference of 0.30%).
| Demographics | Rating | Rank | 4 or more Vehicles in Household |
| Immigrants | Korea | 93.8 /100 | #127 | Exceptional 6.8% |
| Immigrants | Bolivia | 92.5 /100 | #128 | Exceptional 6.7% |
| Immigrants | England | 92.0 /100 | #129 | Exceptional 6.7% |
| Immigrants | Scotland | 89.0 /100 | #130 | Excellent 6.7% |
| Maltese | 88.4 /100 | #131 | Excellent 6.7% |
| Immigrants | Netherlands | 87.8 /100 | #132 | Excellent 6.6% |
| Armenians | 86.9 /100 | #133 | Excellent 6.6% |
| Ottawa | 86.9 /100 | #134 | Excellent 6.6% |
| Tohono O'odham | 86.7 /100 | #135 | Excellent 6.6% |
| Luxembourgers | 86.4 /100 | #136 | Excellent 6.6% |
| French Canadians | 85.4 /100 | #137 | Excellent 6.6% |
| Italians | 84.5 /100 | #138 | Excellent 6.6% |
| Jordanians | 82.1 /100 | #139 | Excellent 6.6% |
| Slavs | 81.6 /100 | #140 | Excellent 6.6% |
| Australians | 80.8 /100 | #141 | Excellent 6.6% |