Kenyan vs Carpatho Rusyn Male Disability
COMPARE
Kenyan
Carpatho Rusyn
Male Disability
Male Disability Comparison
Kenyans
Carpatho Rusyns
11.0%
MALE DISABILITY
78.1/ 100
METRIC RATING
144th/ 347
METRIC RANK
11.9%
MALE DISABILITY
1.3/ 100
METRIC RATING
237th/ 347
METRIC RANK
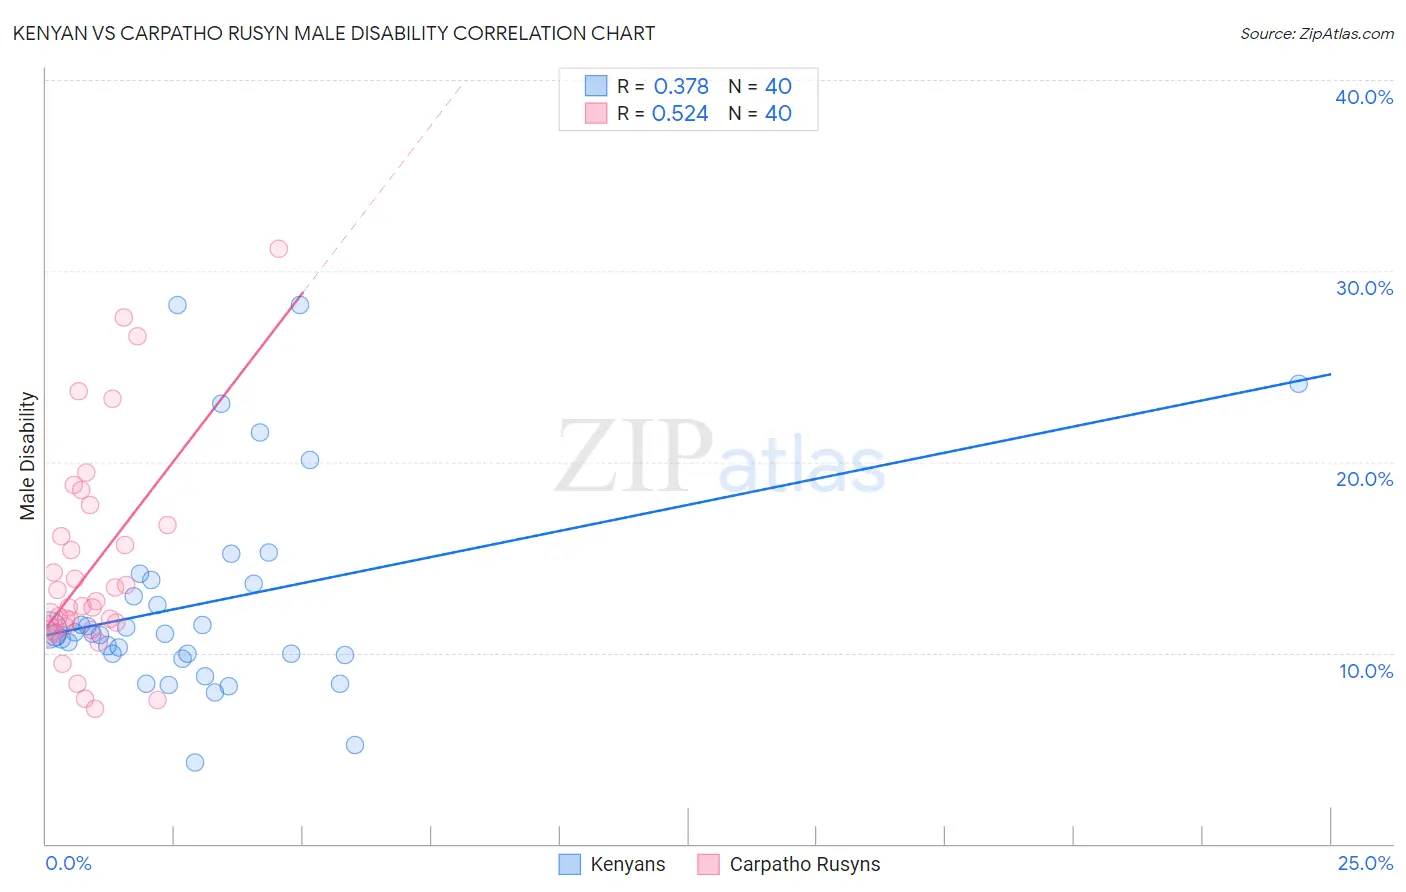
Kenyan vs Carpatho Rusyn Male Disability Correlation Chart
The statistical analysis conducted on geographies consisting of 168,198,768 people shows a mild positive correlation between the proportion of Kenyans and percentage of males with a disability in the United States with a correlation coefficient (R) of 0.378 and weighted average of 11.0%. Similarly, the statistical analysis conducted on geographies consisting of 58,870,293 people shows a substantial positive correlation between the proportion of Carpatho Rusyns and percentage of males with a disability in the United States with a correlation coefficient (R) of 0.524 and weighted average of 11.9%, a difference of 7.9%.
Male Disability Correlation Summary
| Measurement | Kenyan | Carpatho Rusyn |
| Minimum | 4.2% | 7.0% |
| Maximum | 28.2% | 31.1% |
| Range | 24.0% | 24.1% |
| Mean | 12.6% | 14.4% |
| Median | 11.0% | 12.4% |
| Interquartile 25% (IQ1) | 9.9% | 11.3% |
| Interquartile 75% (IQ3) | 13.7% | 16.4% |
| Interquartile Range (IQR) | 3.8% | 5.1% |
| Standard Deviation (Sample) | 5.5% | 5.5% |
| Standard Deviation (Population) | 5.5% | 5.5% |
Similar Demographics by Male Disability
Demographics Similar to Kenyans by Male Disability
In terms of male disability, the demographic groups most similar to Kenyans are Costa Rican (11.0%, a difference of 0.010%), Korean (11.0%, a difference of 0.050%), Immigrants from Croatia (11.0%, a difference of 0.070%), Sudanese (11.0%, a difference of 0.080%), and Immigrants from Denmark (11.0%, a difference of 0.14%).
| Demographics | Rating | Rank | Male Disability |
| Immigrants | Europe | 82.0 /100 | #137 | Excellent 11.0% |
| Nigerians | 81.9 /100 | #138 | Excellent 11.0% |
| South Africans | 81.7 /100 | #139 | Excellent 11.0% |
| Immigrants | Italy | 81.5 /100 | #140 | Excellent 11.0% |
| Arabs | 81.5 /100 | #141 | Excellent 11.0% |
| Immigrants | Sudan | 81.5 /100 | #142 | Excellent 11.0% |
| Moroccans | 80.7 /100 | #143 | Excellent 11.0% |
| Kenyans | 78.1 /100 | #144 | Good 11.0% |
| Costa Ricans | 78.0 /100 | #145 | Good 11.0% |
| Koreans | 77.5 /100 | #146 | Good 11.0% |
| Immigrants | Croatia | 77.3 /100 | #147 | Good 11.0% |
| Sudanese | 77.1 /100 | #148 | Good 11.0% |
| Immigrants | Denmark | 76.4 /100 | #149 | Good 11.0% |
| Immigrants | Guatemala | 75.1 /100 | #150 | Good 11.0% |
| Cubans | 74.9 /100 | #151 | Good 11.0% |
Demographics Similar to Carpatho Rusyns by Male Disability
In terms of male disability, the demographic groups most similar to Carpatho Rusyns are U.S. Virgin Islander (11.9%, a difference of 0.010%), Yugoslavian (11.9%, a difference of 0.10%), Immigrants from North America (11.9%, a difference of 0.15%), Italian (11.9%, a difference of 0.15%), and Czech (11.9%, a difference of 0.20%).
| Demographics | Rating | Rank | Male Disability |
| Croatians | 2.1 /100 | #230 | Tragic 11.8% |
| Dominicans | 1.8 /100 | #231 | Tragic 11.8% |
| Malaysians | 1.8 /100 | #232 | Tragic 11.8% |
| Mexicans | 1.7 /100 | #233 | Tragic 11.8% |
| Immigrants | Canada | 1.6 /100 | #234 | Tragic 11.9% |
| Immigrants | North America | 1.5 /100 | #235 | Tragic 11.9% |
| U.S. Virgin Islanders | 1.3 /100 | #236 | Tragic 11.9% |
| Carpatho Rusyns | 1.3 /100 | #237 | Tragic 11.9% |
| Yugoslavians | 1.2 /100 | #238 | Tragic 11.9% |
| Italians | 1.2 /100 | #239 | Tragic 11.9% |
| Czechs | 1.1 /100 | #240 | Tragic 11.9% |
| Bahamians | 1.1 /100 | #241 | Tragic 11.9% |
| Northern Europeans | 1.1 /100 | #242 | Tragic 11.9% |
| Samoans | 1.1 /100 | #243 | Tragic 11.9% |
| Immigrants | Laos | 1.0 /100 | #244 | Tragic 11.9% |