Kenyan vs Carpatho Rusyn Cognitive Disability
COMPARE
Kenyan
Carpatho Rusyn
Cognitive Disability
Cognitive Disability Comparison
Kenyans
Carpatho Rusyns
18.1%
COGNITIVE DISABILITY
0.1/ 100
METRIC RATING
286th/ 347
METRIC RANK
17.0%
COGNITIVE DISABILITY
89.6/ 100
METRIC RATING
142nd/ 347
METRIC RANK
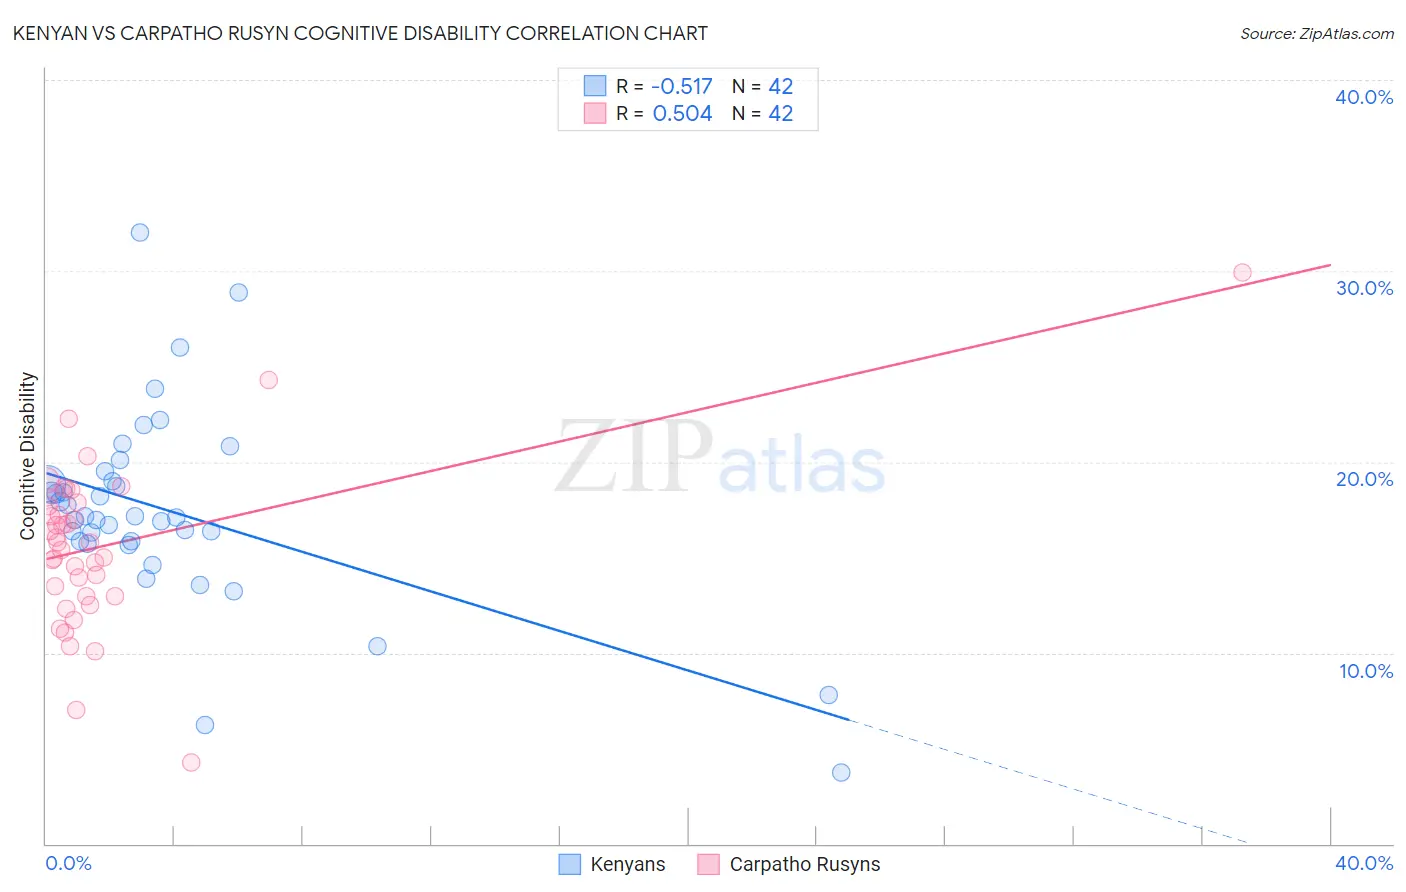
Kenyan vs Carpatho Rusyn Cognitive Disability Correlation Chart
The statistical analysis conducted on geographies consisting of 168,212,811 people shows a substantial negative correlation between the proportion of Kenyans and percentage of population with cognitive disability in the United States with a correlation coefficient (R) of -0.517 and weighted average of 18.1%. Similarly, the statistical analysis conducted on geographies consisting of 58,872,415 people shows a substantial positive correlation between the proportion of Carpatho Rusyns and percentage of population with cognitive disability in the United States with a correlation coefficient (R) of 0.504 and weighted average of 17.0%, a difference of 6.6%.
Cognitive Disability Correlation Summary
| Measurement | Kenyan | Carpatho Rusyn |
| Minimum | 3.7% | 4.3% |
| Maximum | 32.0% | 29.9% |
| Range | 28.2% | 25.6% |
| Mean | 17.4% | 15.6% |
| Median | 17.1% | 15.8% |
| Interquartile 25% (IQ1) | 15.8% | 13.0% |
| Interquartile 75% (IQ3) | 19.0% | 17.9% |
| Interquartile Range (IQR) | 3.2% | 4.9% |
| Standard Deviation (Sample) | 5.1% | 4.4% |
| Standard Deviation (Population) | 5.1% | 4.3% |
Similar Demographics by Cognitive Disability
Demographics Similar to Kenyans by Cognitive Disability
In terms of cognitive disability, the demographic groups most similar to Kenyans are Bermudan (18.1%, a difference of 0.040%), Dutch West Indian (18.1%, a difference of 0.040%), Immigrants from Uganda (18.1%, a difference of 0.050%), Immigrants from West Indies (18.1%, a difference of 0.050%), and Native/Alaskan (18.1%, a difference of 0.060%).
| Demographics | Rating | Rank | Cognitive Disability |
| Chippewa | 0.1 /100 | #279 | Tragic 18.1% |
| West Indians | 0.1 /100 | #280 | Tragic 18.1% |
| Yakama | 0.1 /100 | #281 | Tragic 18.1% |
| Immigrants | Cambodia | 0.1 /100 | #282 | Tragic 18.1% |
| Nigerians | 0.1 /100 | #283 | Tragic 18.1% |
| Immigrants | Uganda | 0.1 /100 | #284 | Tragic 18.1% |
| Bermudans | 0.1 /100 | #285 | Tragic 18.1% |
| Kenyans | 0.1 /100 | #286 | Tragic 18.1% |
| Dutch West Indians | 0.1 /100 | #287 | Tragic 18.1% |
| Immigrants | West Indies | 0.1 /100 | #288 | Tragic 18.1% |
| Natives/Alaskans | 0.1 /100 | #289 | Tragic 18.1% |
| Immigrants | Africa | 0.1 /100 | #290 | Tragic 18.1% |
| Ottawa | 0.1 /100 | #291 | Tragic 18.2% |
| Iroquois | 0.1 /100 | #292 | Tragic 18.2% |
| Central American Indians | 0.1 /100 | #293 | Tragic 18.2% |
Demographics Similar to Carpatho Rusyns by Cognitive Disability
In terms of cognitive disability, the demographic groups most similar to Carpatho Rusyns are Aleut (17.0%, a difference of 0.020%), British (17.0%, a difference of 0.020%), Immigrants from Brazil (17.0%, a difference of 0.020%), French (17.0%, a difference of 0.030%), and Chilean (17.0%, a difference of 0.030%).
| Demographics | Rating | Rank | Cognitive Disability |
| Lebanese | 91.3 /100 | #135 | Exceptional 17.0% |
| Israelis | 91.0 /100 | #136 | Exceptional 17.0% |
| Immigrants | Norway | 90.9 /100 | #137 | Exceptional 17.0% |
| Welsh | 90.8 /100 | #138 | Exceptional 17.0% |
| French | 90.0 /100 | #139 | Excellent 17.0% |
| Chileans | 89.9 /100 | #140 | Excellent 17.0% |
| Aleuts | 89.9 /100 | #141 | Excellent 17.0% |
| Carpatho Rusyns | 89.6 /100 | #142 | Excellent 17.0% |
| British | 89.3 /100 | #143 | Excellent 17.0% |
| Immigrants | Brazil | 89.3 /100 | #144 | Excellent 17.0% |
| Immigrants | South Eastern Asia | 88.7 /100 | #145 | Excellent 17.0% |
| Costa Ricans | 88.0 /100 | #146 | Excellent 17.0% |
| Scotch-Irish | 85.9 /100 | #147 | Excellent 17.1% |
| French Canadians | 85.7 /100 | #148 | Excellent 17.1% |
| Cypriots | 85.7 /100 | #149 | Excellent 17.1% |