Iranian vs Immigrants from Scotland 2 or more Vehicles in Household
COMPARE
Iranian
Immigrants from Scotland
2 or more Vehicles in Household
2 or more Vehicles in Household Comparison
Iranians
Immigrants from Scotland
58.1%
2 OR MORE VEHICLES IN HOUSEHOLD
99.3/ 100
METRIC RATING
82nd/ 347
METRIC RANK
58.9%
2 OR MORE VEHICLES IN HOUSEHOLD
99.8/ 100
METRIC RATING
58th/ 347
METRIC RANK
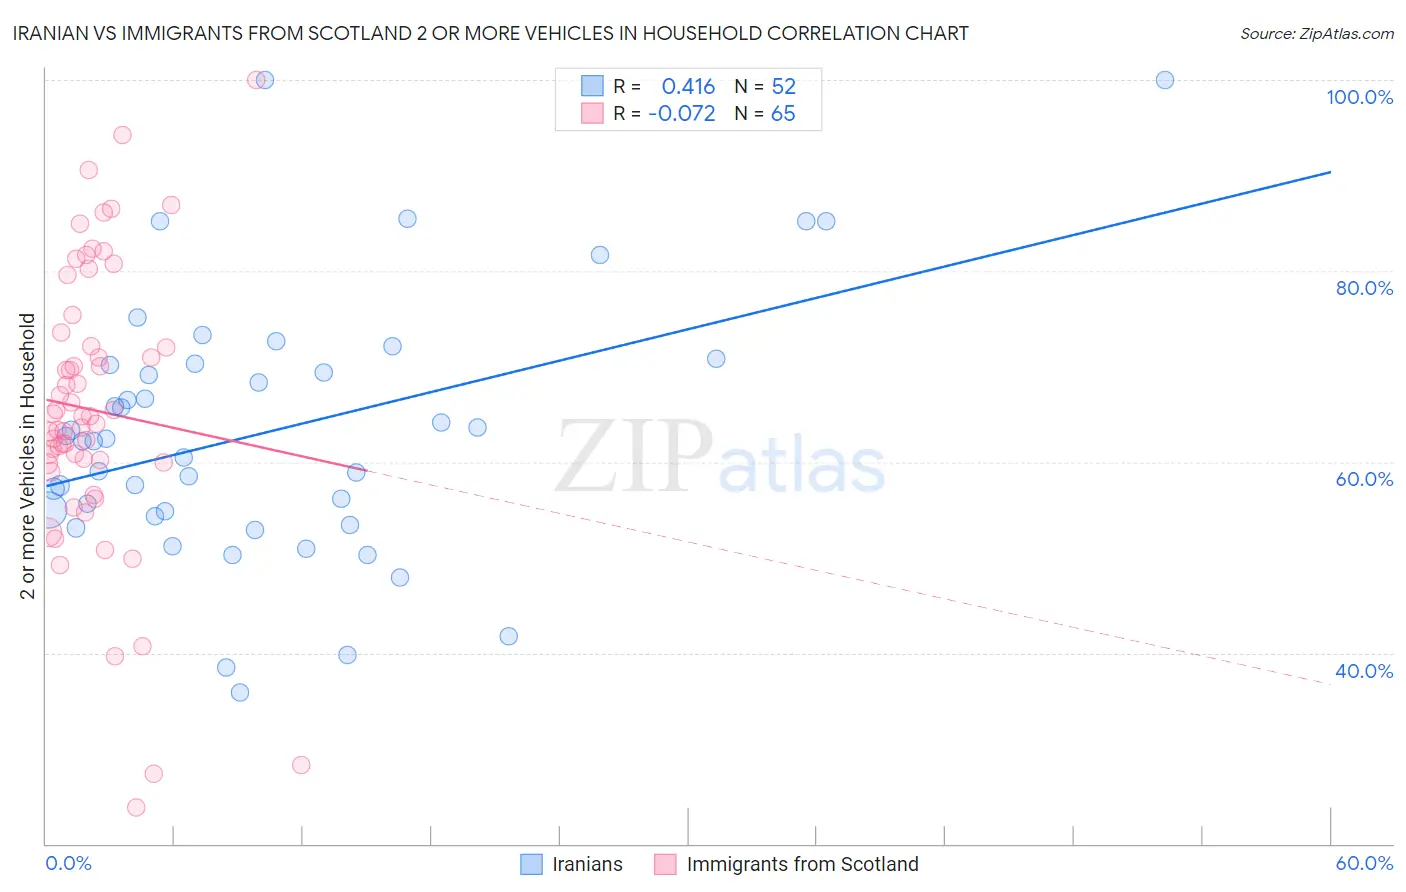
Iranian vs Immigrants from Scotland 2 or more Vehicles in Household Correlation Chart
The statistical analysis conducted on geographies consisting of 316,668,802 people shows a moderate positive correlation between the proportion of Iranians and percentage of households with 2 or more vehicles available in the United States with a correlation coefficient (R) of 0.416 and weighted average of 58.1%. Similarly, the statistical analysis conducted on geographies consisting of 196,383,501 people shows a slight negative correlation between the proportion of Immigrants from Scotland and percentage of households with 2 or more vehicles available in the United States with a correlation coefficient (R) of -0.072 and weighted average of 58.9%, a difference of 1.4%.
2 or more Vehicles in Household Correlation Summary
| Measurement | Iranian | Immigrants from Scotland |
| Minimum | 35.8% | 23.8% |
| Maximum | 100.0% | 100.0% |
| Range | 64.2% | 76.2% |
| Mean | 63.3% | 65.4% |
| Median | 62.3% | 64.8% |
| Interquartile 25% (IQ1) | 54.6% | 59.9% |
| Interquartile 75% (IQ3) | 70.2% | 72.8% |
| Interquartile Range (IQR) | 15.7% | 13.0% |
| Standard Deviation (Sample) | 13.8% | 14.8% |
| Standard Deviation (Population) | 13.7% | 14.7% |
Similar Demographics by 2 or more Vehicles in Household
Demographics Similar to Iranians by 2 or more Vehicles in Household
In terms of 2 or more vehicles in household, the demographic groups most similar to Iranians are Icelander (58.0%, a difference of 0.040%), Maltese (58.0%, a difference of 0.070%), Immigrants from Iraq (58.1%, a difference of 0.080%), Immigrants from England (58.1%, a difference of 0.10%), and Slovak (58.0%, a difference of 0.13%).
| Demographics | Rating | Rank | 2 or more Vehicles in Household |
| Poles | 99.5 /100 | #75 | Exceptional 58.3% |
| Creek | 99.5 /100 | #76 | Exceptional 58.3% |
| Slovenes | 99.5 /100 | #77 | Exceptional 58.3% |
| Lithuanians | 99.5 /100 | #78 | Exceptional 58.2% |
| Delaware | 99.4 /100 | #79 | Exceptional 58.2% |
| Immigrants | England | 99.3 /100 | #80 | Exceptional 58.1% |
| Immigrants | Iraq | 99.3 /100 | #81 | Exceptional 58.1% |
| Iranians | 99.3 /100 | #82 | Exceptional 58.1% |
| Icelanders | 99.2 /100 | #83 | Exceptional 58.0% |
| Maltese | 99.2 /100 | #84 | Exceptional 58.0% |
| Slovaks | 99.2 /100 | #85 | Exceptional 58.0% |
| Potawatomi | 99.1 /100 | #86 | Exceptional 58.0% |
| Thais | 99.1 /100 | #87 | Exceptional 57.9% |
| Immigrants | Iran | 99.1 /100 | #88 | Exceptional 57.9% |
| Immigrants | Germany | 99.0 /100 | #89 | Exceptional 57.9% |
Demographics Similar to Immigrants from Scotland by 2 or more Vehicles in Household
In terms of 2 or more vehicles in household, the demographic groups most similar to Immigrants from Scotland are Spanish American (58.9%, a difference of 0.020%), French Canadian (58.9%, a difference of 0.050%), Afghan (59.0%, a difference of 0.18%), Osage (58.8%, a difference of 0.18%), and Chickasaw (59.0%, a difference of 0.19%).
| Demographics | Rating | Rank | 2 or more Vehicles in Household |
| Spaniards | 99.9 /100 | #51 | Exceptional 59.2% |
| Immigrants | Laos | 99.9 /100 | #52 | Exceptional 59.2% |
| Celtics | 99.9 /100 | #53 | Exceptional 59.2% |
| Bhutanese | 99.9 /100 | #54 | Exceptional 59.1% |
| Luxembourgers | 99.9 /100 | #55 | Exceptional 59.1% |
| Chickasaw | 99.9 /100 | #56 | Exceptional 59.0% |
| Afghans | 99.9 /100 | #57 | Exceptional 59.0% |
| Immigrants | Scotland | 99.8 /100 | #58 | Exceptional 58.9% |
| Spanish Americans | 99.8 /100 | #59 | Exceptional 58.9% |
| French Canadians | 99.8 /100 | #60 | Exceptional 58.9% |
| Osage | 99.8 /100 | #61 | Exceptional 58.8% |
| Immigrants | Nonimmigrants | 99.8 /100 | #62 | Exceptional 58.8% |
| Mexican American Indians | 99.8 /100 | #63 | Exceptional 58.7% |
| Portuguese | 99.7 /100 | #64 | Exceptional 58.6% |
| Immigrants | Central America | 99.7 /100 | #65 | Exceptional 58.6% |