Iranian vs Immigrants from Scotland Unemployment Among Women with Children Under 18 years
COMPARE
Iranian
Immigrants from Scotland
Unemployment Among Women with Children Under 18 years
Unemployment Among Women with Children Under 18 years Comparison
Iranians
Immigrants from Scotland
5.2%
UNEMPLOYMENT AMONG WOMEN WITH CHILDREN UNDER 18 YEARS
89.7/ 100
METRIC RATING
108th/ 347
METRIC RANK
5.2%
UNEMPLOYMENT AMONG WOMEN WITH CHILDREN UNDER 18 YEARS
94.5/ 100
METRIC RATING
88th/ 347
METRIC RANK
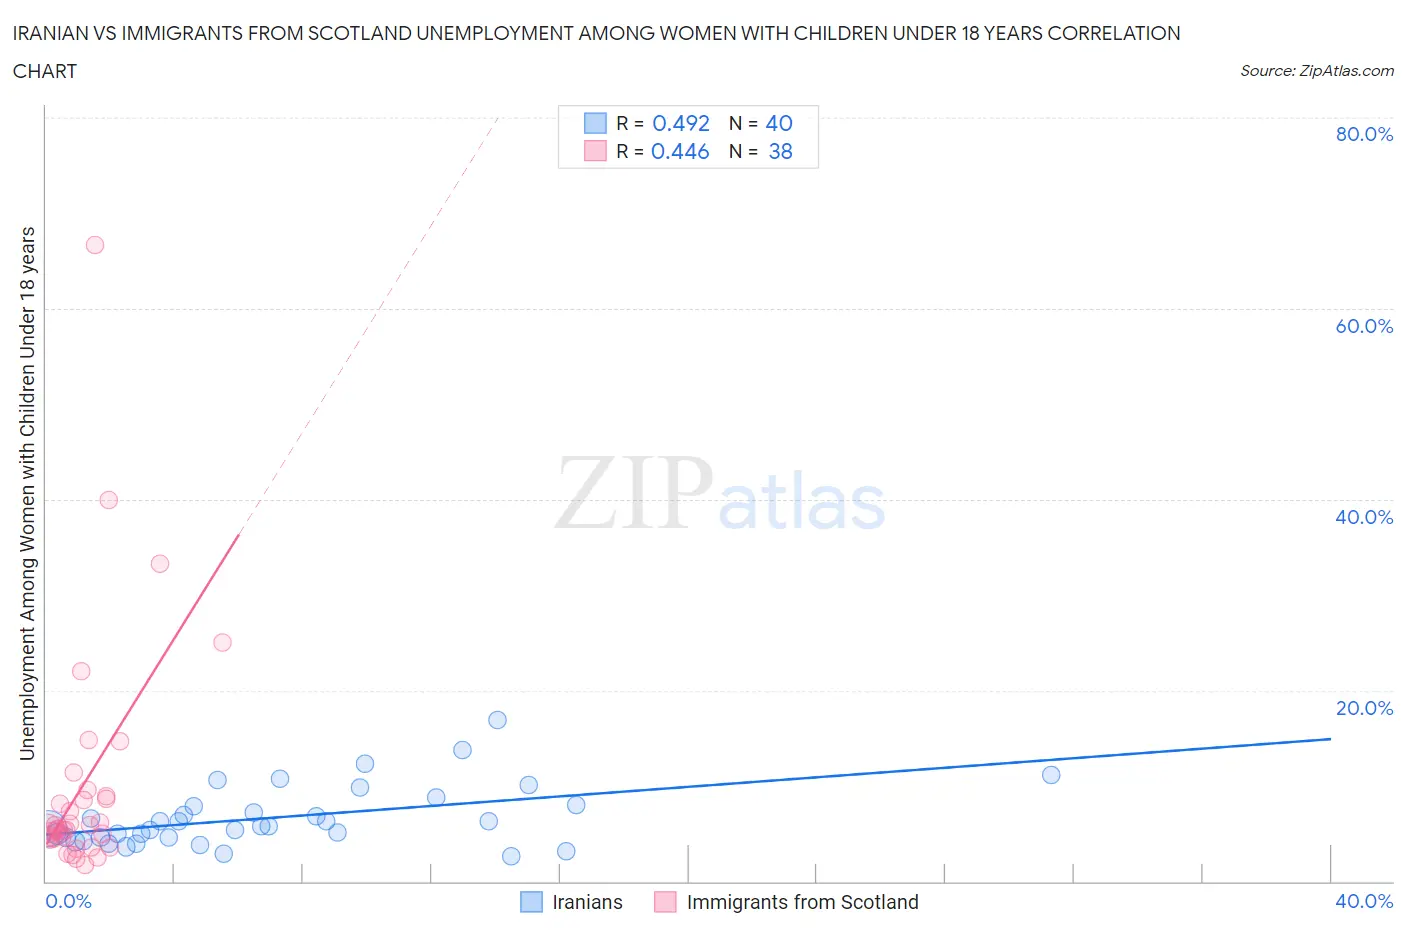
Iranian vs Immigrants from Scotland Unemployment Among Women with Children Under 18 years Correlation Chart
The statistical analysis conducted on geographies consisting of 307,838,151 people shows a moderate positive correlation between the proportion of Iranians and unemployment rate among women with children under the age of 18 in the United States with a correlation coefficient (R) of 0.492 and weighted average of 5.2%. Similarly, the statistical analysis conducted on geographies consisting of 191,273,619 people shows a moderate positive correlation between the proportion of Immigrants from Scotland and unemployment rate among women with children under the age of 18 in the United States with a correlation coefficient (R) of 0.446 and weighted average of 5.2%, a difference of 1.3%.
Unemployment Among Women with Children Under 18 years Correlation Summary
| Measurement | Iranian | Immigrants from Scotland |
| Minimum | 2.6% | 1.7% |
| Maximum | 16.9% | 66.7% |
| Range | 14.3% | 65.0% |
| Mean | 6.7% | 10.2% |
| Median | 5.8% | 5.5% |
| Interquartile 25% (IQ1) | 4.5% | 4.4% |
| Interquartile 75% (IQ3) | 7.9% | 8.9% |
| Interquartile Range (IQR) | 3.4% | 4.5% |
| Standard Deviation (Sample) | 3.2% | 12.6% |
| Standard Deviation (Population) | 3.1% | 12.4% |
Demographics Similar to Iranians and Immigrants from Scotland by Unemployment Among Women with Children Under 18 years
In terms of unemployment among women with children under 18 years, the demographic groups most similar to Iranians are Slavic (5.2%, a difference of 0.040%), Pakistani (5.2%, a difference of 0.050%), Immigrants from France (5.2%, a difference of 0.070%), Immigrants from Switzerland (5.2%, a difference of 0.090%), and Sri Lankan (5.2%, a difference of 0.13%). Similarly, the demographic groups most similar to Immigrants from Scotland are Immigrants from Turkey (5.2%, a difference of 0.10%), Ukrainian (5.2%, a difference of 0.23%), Immigrants from Zimbabwe (5.2%, a difference of 0.31%), Immigrants from Pakistan (5.2%, a difference of 0.39%), and Immigrants from Canada (5.2%, a difference of 0.40%).
| Demographics | Rating | Rank | Unemployment Among Women with Children Under 18 years |
| Immigrants | Scotland | 94.5 /100 | #88 | Exceptional 5.2% |
| Immigrants | Turkey | 94.2 /100 | #89 | Exceptional 5.2% |
| Ukrainians | 93.8 /100 | #90 | Exceptional 5.2% |
| Immigrants | Zimbabwe | 93.6 /100 | #91 | Exceptional 5.2% |
| Immigrants | Pakistan | 93.3 /100 | #92 | Exceptional 5.2% |
| Immigrants | Canada | 93.3 /100 | #93 | Exceptional 5.2% |
| Immigrants | Kuwait | 92.6 /100 | #94 | Exceptional 5.2% |
| Immigrants | North America | 92.3 /100 | #95 | Exceptional 5.2% |
| Immigrants | Albania | 92.2 /100 | #96 | Exceptional 5.2% |
| Palestinians | 92.2 /100 | #97 | Exceptional 5.2% |
| Immigrants | Vietnam | 92.0 /100 | #98 | Exceptional 5.2% |
| Cubans | 91.8 /100 | #99 | Exceptional 5.2% |
| Immigrants | Greece | 91.4 /100 | #100 | Exceptional 5.2% |
| Immigrants | Netherlands | 91.0 /100 | #101 | Exceptional 5.2% |
| Immigrants | Cuba | 90.9 /100 | #102 | Exceptional 5.2% |
| Sri Lankans | 90.3 /100 | #103 | Exceptional 5.2% |
| Immigrants | Switzerland | 90.1 /100 | #104 | Exceptional 5.2% |
| Immigrants | France | 90.0 /100 | #105 | Excellent 5.2% |
| Pakistanis | 89.9 /100 | #106 | Excellent 5.2% |
| Slavs | 89.8 /100 | #107 | Excellent 5.2% |
| Iranians | 89.7 /100 | #108 | Excellent 5.2% |