Iranian vs Immigrants from Scotland Median Female Earnings
COMPARE
Iranian
Immigrants from Scotland
Median Female Earnings
Median Female Earnings Comparison
Iranians
Immigrants from Scotland
$47,421
MEDIAN FEMALE EARNINGS
100.0/ 100
METRIC RATING
8th/ 347
METRIC RANK
$41,771
MEDIAN FEMALE EARNINGS
98.7/ 100
METRIC RATING
98th/ 347
METRIC RANK
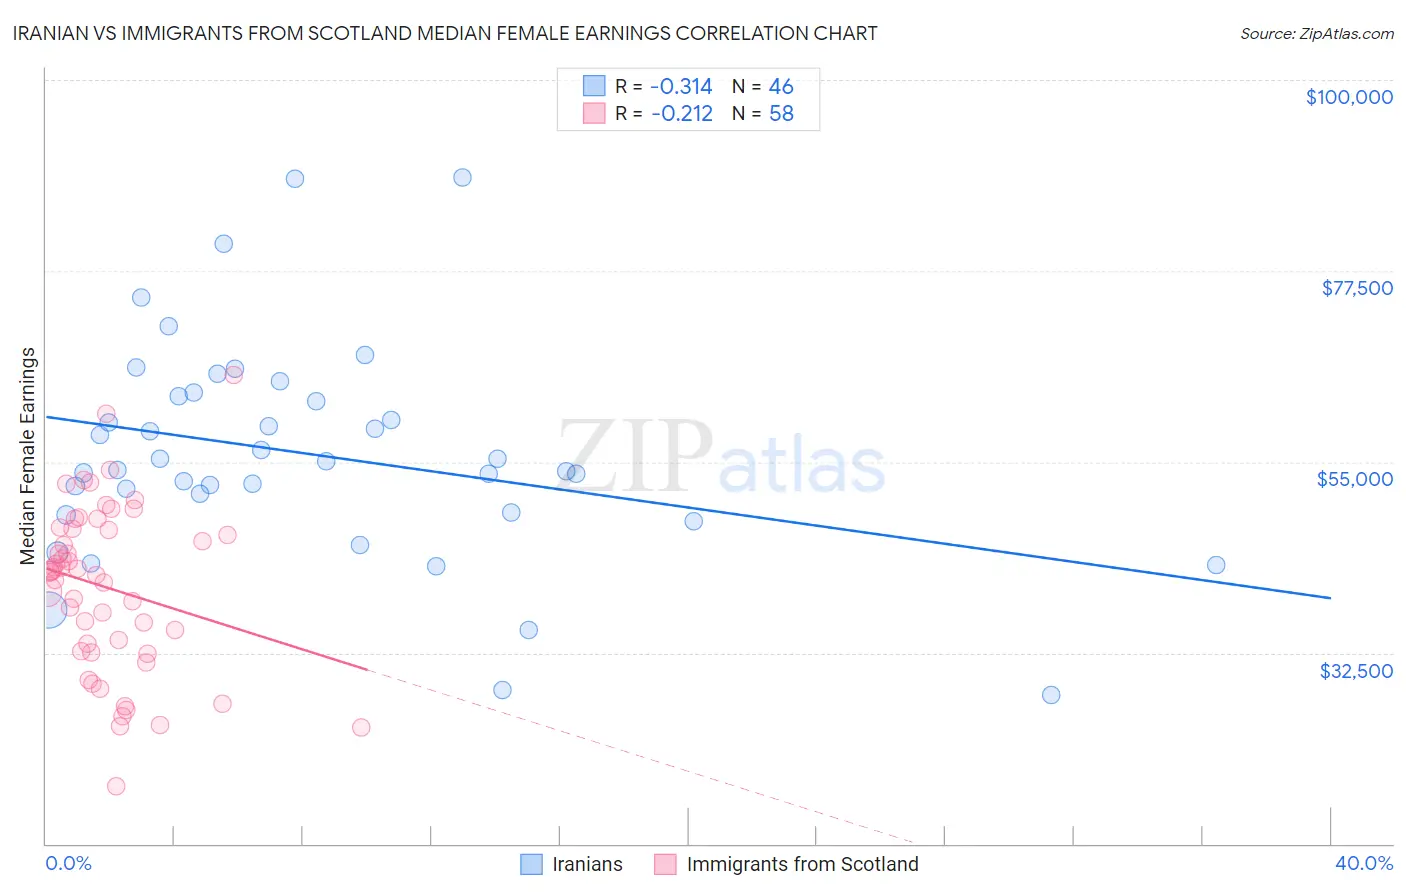
Iranian vs Immigrants from Scotland Median Female Earnings Correlation Chart
The statistical analysis conducted on geographies consisting of 316,781,668 people shows a mild negative correlation between the proportion of Iranians and median female earnings in the United States with a correlation coefficient (R) of -0.314 and weighted average of $47,421. Similarly, the statistical analysis conducted on geographies consisting of 196,348,950 people shows a weak negative correlation between the proportion of Immigrants from Scotland and median female earnings in the United States with a correlation coefficient (R) of -0.212 and weighted average of $41,771, a difference of 13.5%.
Median Female Earnings Correlation Summary
| Measurement | Iranian | Immigrants from Scotland |
| Minimum | $27,465 | $16,733 |
| Maximum | $88,523 | $65,203 |
| Range | $61,058 | $48,470 |
| Mean | $55,900 | $40,188 |
| Median | $54,566 | $42,027 |
| Interquartile 25% (IQ1) | $49,107 | $32,757 |
| Interquartile 75% (IQ3) | $62,773 | $47,181 |
| Interquartile Range (IQR) | $13,666 | $14,424 |
| Standard Deviation (Sample) | $12,815 | $9,888 |
| Standard Deviation (Population) | $12,675 | $9,803 |
Similar Demographics by Median Female Earnings
Demographics Similar to Iranians by Median Female Earnings
In terms of median female earnings, the demographic groups most similar to Iranians are Thai ($47,577, a difference of 0.33%), Immigrants from Ireland ($47,598, a difference of 0.37%), Immigrants from Iran ($47,154, a difference of 0.57%), Immigrants from China ($46,972, a difference of 0.95%), and Okinawan ($46,905, a difference of 1.1%).
| Demographics | Rating | Rank | Median Female Earnings |
| Immigrants | Hong Kong | 100.0 /100 | #1 | Exceptional $49,818 |
| Filipinos | 100.0 /100 | #2 | Exceptional $49,508 |
| Immigrants | Taiwan | 100.0 /100 | #3 | Exceptional $49,256 |
| Immigrants | India | 100.0 /100 | #4 | Exceptional $48,292 |
| Immigrants | Singapore | 100.0 /100 | #5 | Exceptional $47,986 |
| Immigrants | Ireland | 100.0 /100 | #6 | Exceptional $47,598 |
| Thais | 100.0 /100 | #7 | Exceptional $47,577 |
| Iranians | 100.0 /100 | #8 | Exceptional $47,421 |
| Immigrants | Iran | 100.0 /100 | #9 | Exceptional $47,154 |
| Immigrants | China | 100.0 /100 | #10 | Exceptional $46,972 |
| Okinawans | 100.0 /100 | #11 | Exceptional $46,905 |
| Immigrants | Israel | 100.0 /100 | #12 | Exceptional $46,902 |
| Immigrants | Australia | 100.0 /100 | #13 | Exceptional $46,573 |
| Soviet Union | 100.0 /100 | #14 | Exceptional $46,556 |
| Immigrants | Eastern Asia | 100.0 /100 | #15 | Exceptional $46,502 |
Demographics Similar to Immigrants from Scotland by Median Female Earnings
In terms of median female earnings, the demographic groups most similar to Immigrants from Scotland are Immigrants from Hungary ($41,820, a difference of 0.12%), South African ($41,825, a difference of 0.13%), Immigrants from Barbados ($41,685, a difference of 0.21%), Moroccan ($41,872, a difference of 0.24%), and Immigrants from Netherlands ($41,870, a difference of 0.24%).
| Demographics | Rating | Rank | Median Female Earnings |
| Immigrants | Western Europe | 99.2 /100 | #91 | Exceptional $41,990 |
| Argentineans | 99.1 /100 | #92 | Exceptional $41,952 |
| Immigrants | Grenada | 99.0 /100 | #93 | Exceptional $41,932 |
| Moroccans | 98.9 /100 | #94 | Exceptional $41,872 |
| Immigrants | Netherlands | 98.9 /100 | #95 | Exceptional $41,870 |
| South Africans | 98.8 /100 | #96 | Exceptional $41,825 |
| Immigrants | Hungary | 98.8 /100 | #97 | Exceptional $41,820 |
| Immigrants | Scotland | 98.7 /100 | #98 | Exceptional $41,771 |
| Immigrants | Barbados | 98.4 /100 | #99 | Exceptional $41,685 |
| Romanians | 98.3 /100 | #100 | Exceptional $41,663 |
| Immigrants | Fiji | 98.3 /100 | #101 | Exceptional $41,656 |
| Immigrants | Poland | 98.2 /100 | #102 | Exceptional $41,630 |
| Immigrants | Argentina | 97.9 /100 | #103 | Exceptional $41,554 |
| Immigrants | Zimbabwe | 97.8 /100 | #104 | Exceptional $41,527 |
| Italians | 97.7 /100 | #105 | Exceptional $41,505 |