Vietnamese vs Immigrants from Scotland 2 or more Vehicles in Household
COMPARE
Vietnamese
Immigrants from Scotland
2 or more Vehicles in Household
2 or more Vehicles in Household Comparison
Vietnamese
Immigrants from Scotland
38.5%
2 OR MORE VEHICLES IN HOUSEHOLD
0.0/ 100
METRIC RATING
336th/ 347
METRIC RANK
58.9%
2 OR MORE VEHICLES IN HOUSEHOLD
99.8/ 100
METRIC RATING
58th/ 347
METRIC RANK
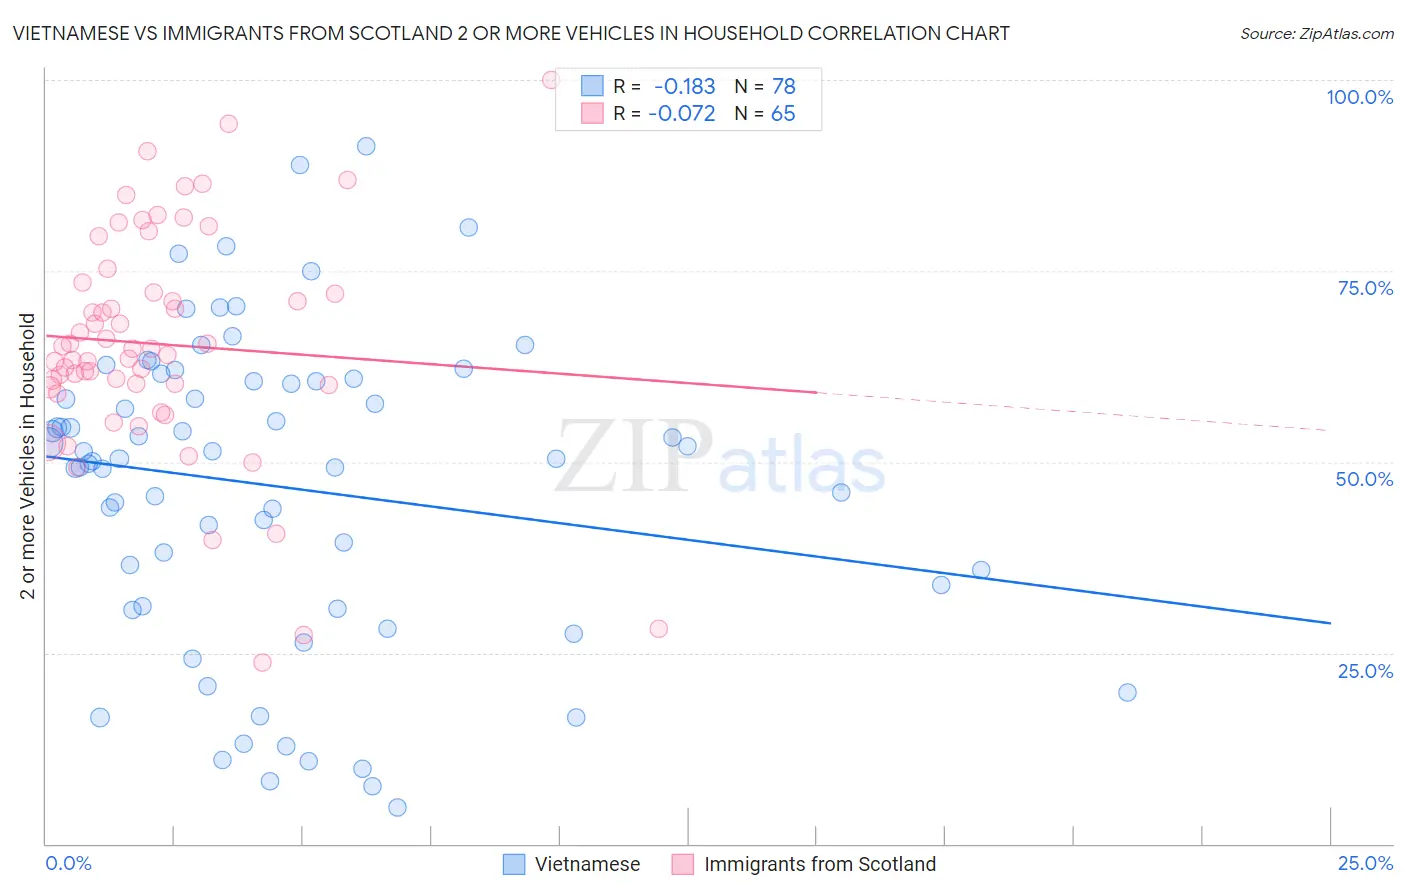
Vietnamese vs Immigrants from Scotland 2 or more Vehicles in Household Correlation Chart
The statistical analysis conducted on geographies consisting of 170,680,365 people shows a poor negative correlation between the proportion of Vietnamese and percentage of households with 2 or more vehicles available in the United States with a correlation coefficient (R) of -0.183 and weighted average of 38.5%. Similarly, the statistical analysis conducted on geographies consisting of 196,383,501 people shows a slight negative correlation between the proportion of Immigrants from Scotland and percentage of households with 2 or more vehicles available in the United States with a correlation coefficient (R) of -0.072 and weighted average of 58.9%, a difference of 53.0%.
2 or more Vehicles in Household Correlation Summary
| Measurement | Vietnamese | Immigrants from Scotland |
| Minimum | 4.7% | 23.8% |
| Maximum | 91.3% | 100.0% |
| Range | 86.6% | 76.2% |
| Mean | 46.7% | 65.4% |
| Median | 50.4% | 64.8% |
| Interquartile 25% (IQ1) | 31.1% | 59.9% |
| Interquartile 75% (IQ3) | 60.6% | 72.8% |
| Interquartile Range (IQR) | 29.5% | 13.0% |
| Standard Deviation (Sample) | 20.3% | 14.8% |
| Standard Deviation (Population) | 20.2% | 14.7% |
Similar Demographics by 2 or more Vehicles in Household
Demographics Similar to Vietnamese by 2 or more Vehicles in Household
In terms of 2 or more vehicles in household, the demographic groups most similar to Vietnamese are Barbadian (38.3%, a difference of 0.41%), Immigrants from Bangladesh (38.8%, a difference of 0.72%), Immigrants from Uzbekistan (37.9%, a difference of 1.6%), Immigrants from Trinidad and Tobago (40.3%, a difference of 4.6%), and Immigrants from Ecuador (40.5%, a difference of 5.2%).
| Demographics | Rating | Rank | 2 or more Vehicles in Household |
| Ecuadorians | 0.0 /100 | #329 | Tragic 42.0% |
| Immigrants | Dominica | 0.0 /100 | #330 | Tragic 41.6% |
| West Indians | 0.0 /100 | #331 | Tragic 41.3% |
| Trinidadians and Tobagonians | 0.0 /100 | #332 | Tragic 40.9% |
| Immigrants | Ecuador | 0.0 /100 | #333 | Tragic 40.5% |
| Immigrants | Trinidad and Tobago | 0.0 /100 | #334 | Tragic 40.3% |
| Immigrants | Bangladesh | 0.0 /100 | #335 | Tragic 38.8% |
| Vietnamese | 0.0 /100 | #336 | Tragic 38.5% |
| Barbadians | 0.0 /100 | #337 | Tragic 38.3% |
| Immigrants | Uzbekistan | 0.0 /100 | #338 | Tragic 37.9% |
| Immigrants | Barbados | 0.0 /100 | #339 | Tragic 35.8% |
| British West Indians | 0.0 /100 | #340 | Tragic 35.4% |
| Guyanese | 0.0 /100 | #341 | Tragic 35.4% |
| Dominicans | 0.0 /100 | #342 | Tragic 35.3% |
| Immigrants | Guyana | 0.0 /100 | #343 | Tragic 35.0% |
Demographics Similar to Immigrants from Scotland by 2 or more Vehicles in Household
In terms of 2 or more vehicles in household, the demographic groups most similar to Immigrants from Scotland are Spanish American (58.9%, a difference of 0.020%), French Canadian (58.9%, a difference of 0.050%), Afghan (59.0%, a difference of 0.18%), Osage (58.8%, a difference of 0.18%), and Chickasaw (59.0%, a difference of 0.19%).
| Demographics | Rating | Rank | 2 or more Vehicles in Household |
| Spaniards | 99.9 /100 | #51 | Exceptional 59.2% |
| Immigrants | Laos | 99.9 /100 | #52 | Exceptional 59.2% |
| Celtics | 99.9 /100 | #53 | Exceptional 59.2% |
| Bhutanese | 99.9 /100 | #54 | Exceptional 59.1% |
| Luxembourgers | 99.9 /100 | #55 | Exceptional 59.1% |
| Chickasaw | 99.9 /100 | #56 | Exceptional 59.0% |
| Afghans | 99.9 /100 | #57 | Exceptional 59.0% |
| Immigrants | Scotland | 99.8 /100 | #58 | Exceptional 58.9% |
| Spanish Americans | 99.8 /100 | #59 | Exceptional 58.9% |
| French Canadians | 99.8 /100 | #60 | Exceptional 58.9% |
| Osage | 99.8 /100 | #61 | Exceptional 58.8% |
| Immigrants | Nonimmigrants | 99.8 /100 | #62 | Exceptional 58.8% |
| Mexican American Indians | 99.8 /100 | #63 | Exceptional 58.7% |
| Portuguese | 99.7 /100 | #64 | Exceptional 58.6% |
| Immigrants | Central America | 99.7 /100 | #65 | Exceptional 58.6% |