Immigrants from Cuba vs Immigrants from Scotland 2 or more Vehicles in Household
COMPARE
Immigrants from Cuba
Immigrants from Scotland
2 or more Vehicles in Household
2 or more Vehicles in Household Comparison
Immigrants from Cuba
Immigrants from Scotland
55.3%
2 OR MORE VEHICLES IN HOUSEHOLD
47.0/ 100
METRIC RATING
176th/ 347
METRIC RANK
58.9%
2 OR MORE VEHICLES IN HOUSEHOLD
99.8/ 100
METRIC RATING
58th/ 347
METRIC RANK
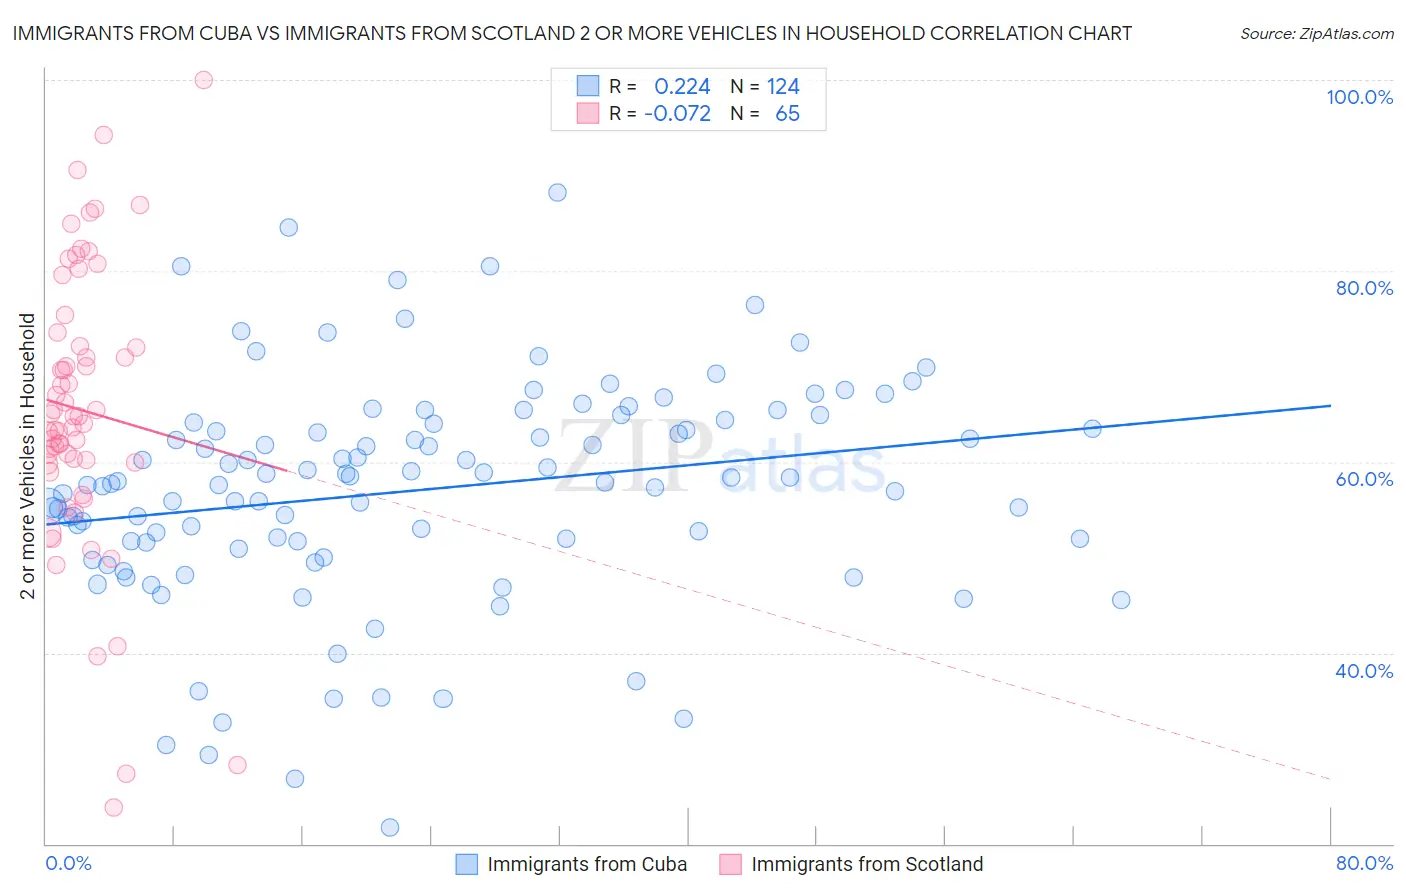
Immigrants from Cuba vs Immigrants from Scotland 2 or more Vehicles in Household Correlation Chart
The statistical analysis conducted on geographies consisting of 325,965,505 people shows a weak positive correlation between the proportion of Immigrants from Cuba and percentage of households with 2 or more vehicles available in the United States with a correlation coefficient (R) of 0.224 and weighted average of 55.3%. Similarly, the statistical analysis conducted on geographies consisting of 196,383,501 people shows a slight negative correlation between the proportion of Immigrants from Scotland and percentage of households with 2 or more vehicles available in the United States with a correlation coefficient (R) of -0.072 and weighted average of 58.9%, a difference of 6.5%.
2 or more Vehicles in Household Correlation Summary
| Measurement | Immigrants from Cuba | Immigrants from Scotland |
| Minimum | 21.7% | 23.8% |
| Maximum | 88.2% | 100.0% |
| Range | 66.5% | 76.2% |
| Mean | 57.0% | 65.4% |
| Median | 57.9% | 64.8% |
| Interquartile 25% (IQ1) | 51.6% | 59.9% |
| Interquartile 75% (IQ3) | 64.0% | 72.8% |
| Interquartile Range (IQR) | 12.4% | 13.0% |
| Standard Deviation (Sample) | 11.7% | 14.8% |
| Standard Deviation (Population) | 11.7% | 14.7% |
Similar Demographics by 2 or more Vehicles in Household
Demographics Similar to Immigrants from Cuba by 2 or more Vehicles in Household
In terms of 2 or more vehicles in household, the demographic groups most similar to Immigrants from Cuba are Menominee (55.3%, a difference of 0.030%), Immigrants from Sweden (55.2%, a difference of 0.070%), Immigrants from Denmark (55.3%, a difference of 0.090%), Navajo (55.3%, a difference of 0.12%), and Immigrants from Western Europe (55.4%, a difference of 0.17%).
| Demographics | Rating | Rank | 2 or more Vehicles in Household |
| Immigrants | Austria | 56.3 /100 | #169 | Average 55.5% |
| Romanians | 55.8 /100 | #170 | Average 55.5% |
| Immigrants | Costa Rica | 54.4 /100 | #171 | Average 55.4% |
| Immigrants | Nicaragua | 51.6 /100 | #172 | Average 55.4% |
| Immigrants | Western Europe | 51.4 /100 | #173 | Average 55.4% |
| Navajo | 50.0 /100 | #174 | Average 55.3% |
| Immigrants | Denmark | 49.4 /100 | #175 | Average 55.3% |
| Immigrants | Cuba | 47.0 /100 | #176 | Average 55.3% |
| Menominee | 46.2 /100 | #177 | Average 55.3% |
| Immigrants | Sweden | 45.3 /100 | #178 | Average 55.2% |
| Alaskan Athabascans | 42.9 /100 | #179 | Average 55.2% |
| Immigrants | Kenya | 40.4 /100 | #180 | Average 55.1% |
| Immigrants | Micronesia | 38.2 /100 | #181 | Fair 55.1% |
| Cree | 38.2 /100 | #182 | Fair 55.1% |
| Immigrants | Cameroon | 37.3 /100 | #183 | Fair 55.1% |
Demographics Similar to Immigrants from Scotland by 2 or more Vehicles in Household
In terms of 2 or more vehicles in household, the demographic groups most similar to Immigrants from Scotland are Spanish American (58.9%, a difference of 0.020%), French Canadian (58.9%, a difference of 0.050%), Afghan (59.0%, a difference of 0.18%), Osage (58.8%, a difference of 0.18%), and Chickasaw (59.0%, a difference of 0.19%).
| Demographics | Rating | Rank | 2 or more Vehicles in Household |
| Spaniards | 99.9 /100 | #51 | Exceptional 59.2% |
| Immigrants | Laos | 99.9 /100 | #52 | Exceptional 59.2% |
| Celtics | 99.9 /100 | #53 | Exceptional 59.2% |
| Bhutanese | 99.9 /100 | #54 | Exceptional 59.1% |
| Luxembourgers | 99.9 /100 | #55 | Exceptional 59.1% |
| Chickasaw | 99.9 /100 | #56 | Exceptional 59.0% |
| Afghans | 99.9 /100 | #57 | Exceptional 59.0% |
| Immigrants | Scotland | 99.8 /100 | #58 | Exceptional 58.9% |
| Spanish Americans | 99.8 /100 | #59 | Exceptional 58.9% |
| French Canadians | 99.8 /100 | #60 | Exceptional 58.9% |
| Osage | 99.8 /100 | #61 | Exceptional 58.8% |
| Immigrants | Nonimmigrants | 99.8 /100 | #62 | Exceptional 58.8% |
| Mexican American Indians | 99.8 /100 | #63 | Exceptional 58.7% |
| Portuguese | 99.7 /100 | #64 | Exceptional 58.6% |
| Immigrants | Central America | 99.7 /100 | #65 | Exceptional 58.6% |