Iranian vs Immigrants from Scotland In Labor Force | Age > 16
COMPARE
Iranian
Immigrants from Scotland
In Labor Force | Age > 16
In Labor Force | Age > 16 Comparison
Iranians
Immigrants from Scotland
66.0%
IN LABOR FORCE | AGE > 16
99.2/ 100
METRIC RATING
91st/ 347
METRIC RANK
64.2%
IN LABOR FORCE | AGE > 16
0.8/ 100
METRIC RATING
258th/ 347
METRIC RANK
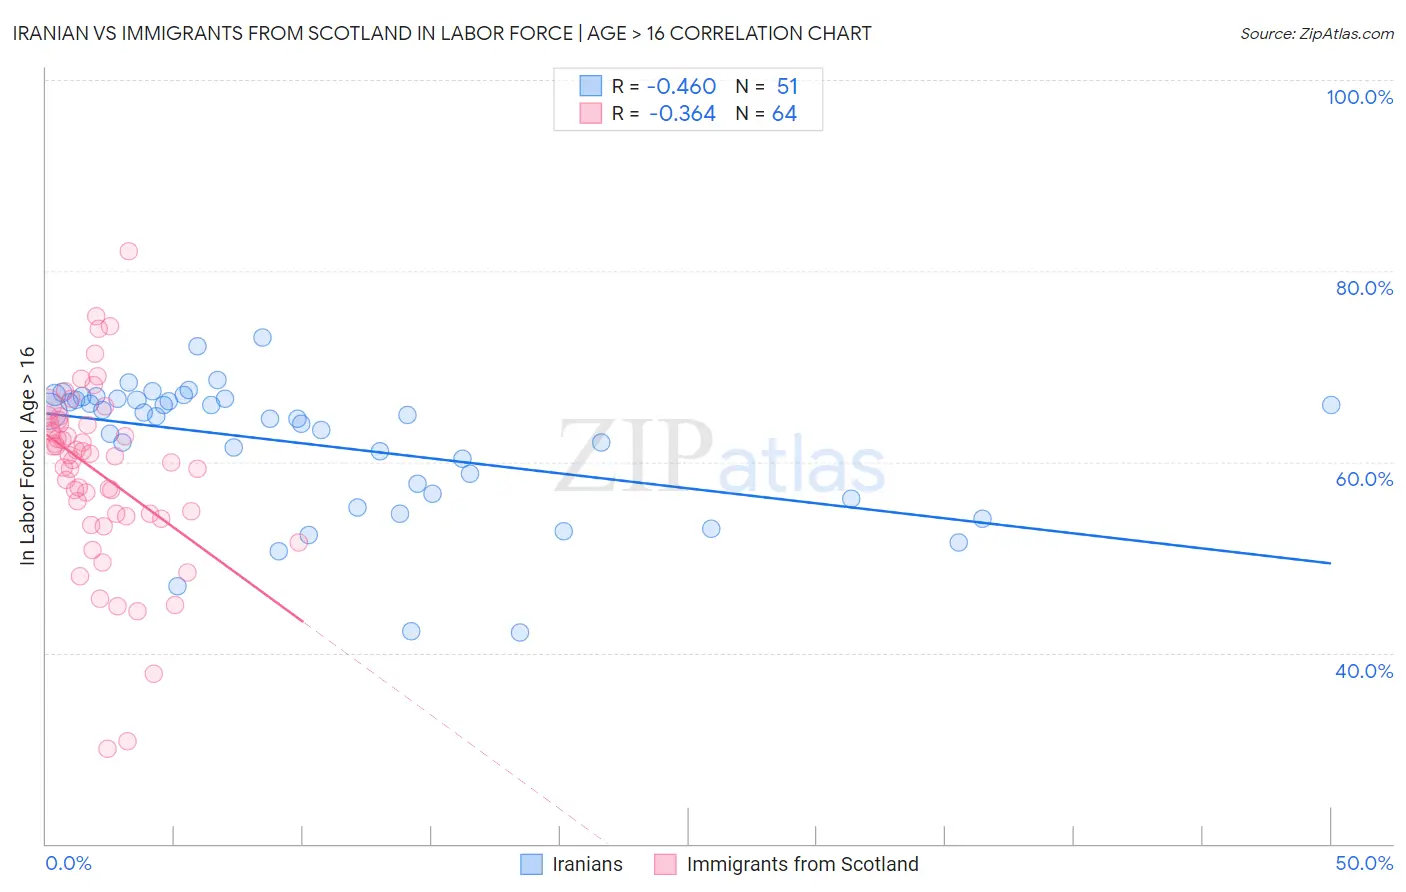
Iranian vs Immigrants from Scotland In Labor Force | Age > 16 Correlation Chart
The statistical analysis conducted on geographies consisting of 316,907,854 people shows a moderate negative correlation between the proportion of Iranians and labor force participation rate among population ages 16 and over in the United States with a correlation coefficient (R) of -0.460 and weighted average of 66.0%. Similarly, the statistical analysis conducted on geographies consisting of 196,399,200 people shows a mild negative correlation between the proportion of Immigrants from Scotland and labor force participation rate among population ages 16 and over in the United States with a correlation coefficient (R) of -0.364 and weighted average of 64.2%, a difference of 2.7%.
In Labor Force | Age > 16 Correlation Summary
| Measurement | Iranian | Immigrants from Scotland |
| Minimum | 42.1% | 30.0% |
| Maximum | 73.0% | 82.1% |
| Range | 30.9% | 52.1% |
| Mean | 61.8% | 58.8% |
| Median | 64.8% | 60.7% |
| Interquartile 25% (IQ1) | 56.7% | 54.4% |
| Interquartile 75% (IQ3) | 66.7% | 64.0% |
| Interquartile Range (IQR) | 10.0% | 9.6% |
| Standard Deviation (Sample) | 7.1% | 9.5% |
| Standard Deviation (Population) | 7.0% | 9.5% |
Similar Demographics by In Labor Force | Age > 16
Demographics Similar to Iranians by In Labor Force | Age > 16
In terms of in labor force | age > 16, the demographic groups most similar to Iranians are Immigrants from Laos (66.0%, a difference of 0.010%), Chilean (66.0%, a difference of 0.010%), Aleut (66.0%, a difference of 0.020%), Immigrants from South America (66.0%, a difference of 0.030%), and Immigrants from Cambodia (66.0%, a difference of 0.040%).
| Demographics | Rating | Rank | In Labor Force | Age > 16 |
| Central Americans | 99.4 /100 | #84 | Exceptional 66.1% |
| Mongolians | 99.4 /100 | #85 | Exceptional 66.1% |
| South Americans | 99.4 /100 | #86 | Exceptional 66.0% |
| South American Indians | 99.4 /100 | #87 | Exceptional 66.0% |
| Bermudans | 99.3 /100 | #88 | Exceptional 66.0% |
| Immigrants | Laos | 99.2 /100 | #89 | Exceptional 66.0% |
| Chileans | 99.2 /100 | #90 | Exceptional 66.0% |
| Iranians | 99.2 /100 | #91 | Exceptional 66.0% |
| Aleuts | 99.1 /100 | #92 | Exceptional 66.0% |
| Immigrants | South America | 99.1 /100 | #93 | Exceptional 66.0% |
| Immigrants | Cambodia | 99.1 /100 | #94 | Exceptional 66.0% |
| Immigrants | Uruguay | 99.1 /100 | #95 | Exceptional 66.0% |
| Bangladeshis | 98.9 /100 | #96 | Exceptional 65.9% |
| Filipinos | 98.9 /100 | #97 | Exceptional 65.9% |
| Immigrants | Chile | 98.7 /100 | #98 | Exceptional 65.9% |
Demographics Similar to Immigrants from Scotland by In Labor Force | Age > 16
In terms of in labor force | age > 16, the demographic groups most similar to Immigrants from Scotland are Inupiat (64.3%, a difference of 0.020%), Immigrants from Western Europe (64.2%, a difference of 0.030%), Marshallese (64.2%, a difference of 0.040%), Basque (64.2%, a difference of 0.040%), and Finnish (64.2%, a difference of 0.050%).
| Demographics | Rating | Rank | In Labor Force | Age > 16 |
| Portuguese | 1.6 /100 | #251 | Tragic 64.4% |
| Immigrants | Dominican Republic | 1.5 /100 | #252 | Tragic 64.4% |
| Czechoslovakians | 1.4 /100 | #253 | Tragic 64.3% |
| Immigrants | Uzbekistan | 1.4 /100 | #254 | Tragic 64.3% |
| Hispanics or Latinos | 1.1 /100 | #255 | Tragic 64.3% |
| Immigrants | Mexico | 1.0 /100 | #256 | Tragic 64.3% |
| Inupiat | 0.8 /100 | #257 | Tragic 64.3% |
| Immigrants | Scotland | 0.8 /100 | #258 | Tragic 64.2% |
| Immigrants | Western Europe | 0.7 /100 | #259 | Tragic 64.2% |
| Marshallese | 0.7 /100 | #260 | Tragic 64.2% |
| Basques | 0.7 /100 | #261 | Tragic 64.2% |
| Finns | 0.7 /100 | #262 | Tragic 64.2% |
| Bahamians | 0.6 /100 | #263 | Tragic 64.2% |
| Dutch | 0.6 /100 | #264 | Tragic 64.2% |
| Cubans | 0.5 /100 | #265 | Tragic 64.2% |