Hmong vs Immigrants from Scotland 2 or more Vehicles in Household
COMPARE
Hmong
Immigrants from Scotland
2 or more Vehicles in Household
2 or more Vehicles in Household Comparison
Hmong
Immigrants from Scotland
57.8%
2 OR MORE VEHICLES IN HOUSEHOLD
98.9/ 100
METRIC RATING
95th/ 347
METRIC RANK
58.9%
2 OR MORE VEHICLES IN HOUSEHOLD
99.8/ 100
METRIC RATING
58th/ 347
METRIC RANK
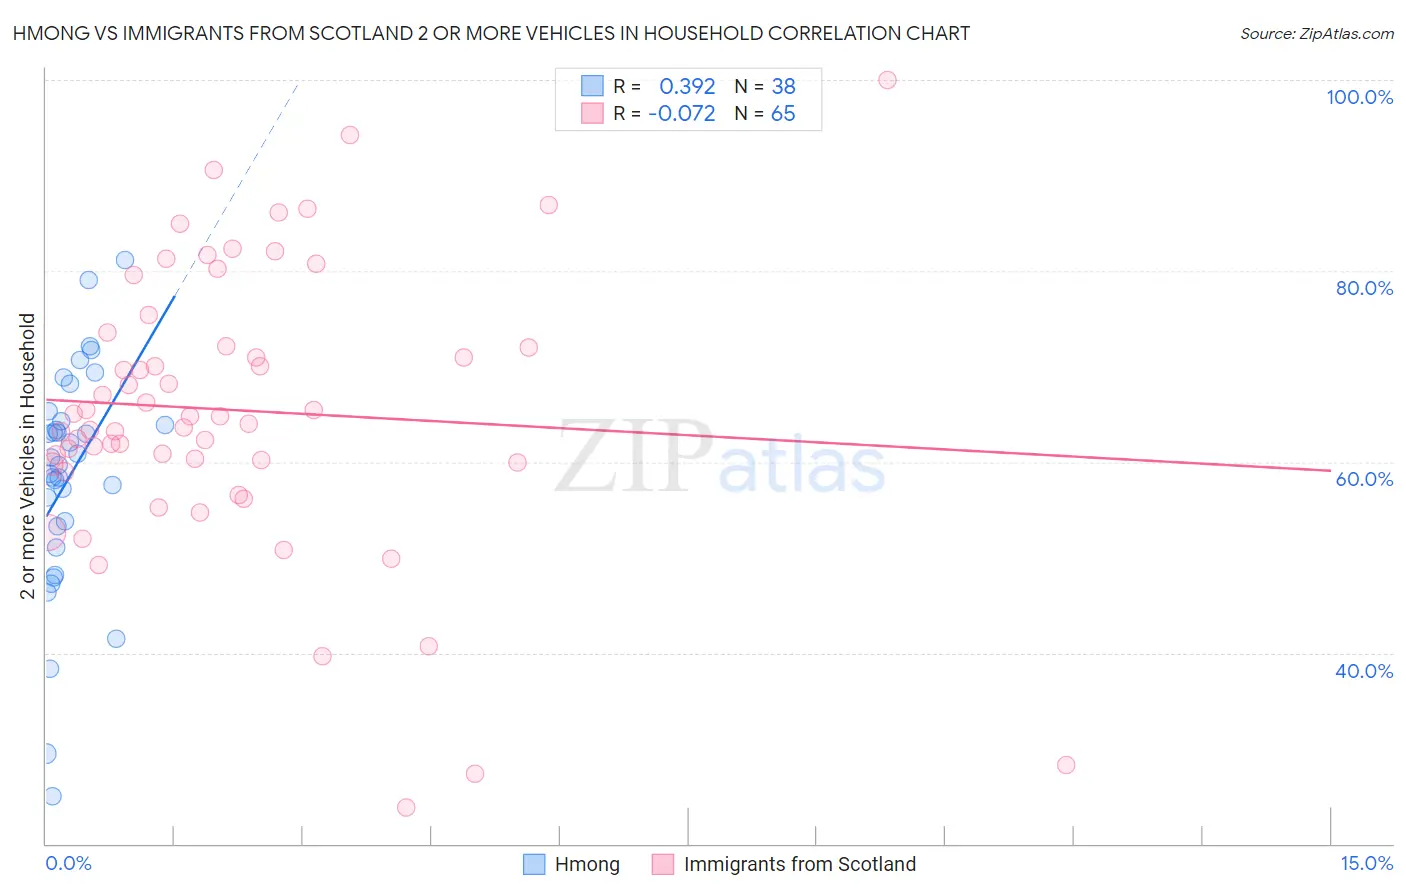
Hmong vs Immigrants from Scotland 2 or more Vehicles in Household Correlation Chart
The statistical analysis conducted on geographies consisting of 24,669,739 people shows a mild positive correlation between the proportion of Hmong and percentage of households with 2 or more vehicles available in the United States with a correlation coefficient (R) of 0.392 and weighted average of 57.8%. Similarly, the statistical analysis conducted on geographies consisting of 196,383,501 people shows a slight negative correlation between the proportion of Immigrants from Scotland and percentage of households with 2 or more vehicles available in the United States with a correlation coefficient (R) of -0.072 and weighted average of 58.9%, a difference of 1.9%.
2 or more Vehicles in Household Correlation Summary
| Measurement | Hmong | Immigrants from Scotland |
| Minimum | 25.0% | 23.8% |
| Maximum | 81.2% | 100.0% |
| Range | 56.2% | 76.2% |
| Mean | 58.4% | 65.4% |
| Median | 60.0% | 64.8% |
| Interquartile 25% (IQ1) | 53.3% | 59.9% |
| Interquartile 75% (IQ3) | 64.2% | 72.8% |
| Interquartile Range (IQR) | 10.9% | 13.0% |
| Standard Deviation (Sample) | 11.9% | 14.8% |
| Standard Deviation (Population) | 11.8% | 14.7% |
Similar Demographics by 2 or more Vehicles in Household
Demographics Similar to Hmong by 2 or more Vehicles in Household
In terms of 2 or more vehicles in household, the demographic groups most similar to Hmong are Filipino (57.8%, a difference of 0.020%), Burmese (57.8%, a difference of 0.030%), Slavic (57.8%, a difference of 0.060%), Ottawa (57.9%, a difference of 0.080%), and Shoshone (57.9%, a difference of 0.090%).
| Demographics | Rating | Rank | 2 or more Vehicles in Household |
| Immigrants | Iran | 99.1 /100 | #88 | Exceptional 57.9% |
| Immigrants | Germany | 99.0 /100 | #89 | Exceptional 57.9% |
| Hispanics or Latinos | 99.0 /100 | #90 | Exceptional 57.9% |
| Pakistanis | 99.0 /100 | #91 | Exceptional 57.9% |
| Shoshone | 99.0 /100 | #92 | Exceptional 57.9% |
| Ottawa | 99.0 /100 | #93 | Exceptional 57.9% |
| Filipinos | 98.9 /100 | #94 | Exceptional 57.8% |
| Hmong | 98.9 /100 | #95 | Exceptional 57.8% |
| Burmese | 98.8 /100 | #96 | Exceptional 57.8% |
| Slavs | 98.8 /100 | #97 | Exceptional 57.8% |
| Palestinians | 98.6 /100 | #98 | Exceptional 57.7% |
| Cajuns | 98.5 /100 | #99 | Exceptional 57.7% |
| Fijians | 98.4 /100 | #100 | Exceptional 57.6% |
| Lebanese | 98.3 /100 | #101 | Exceptional 57.6% |
| Immigrants | Bolivia | 98.2 /100 | #102 | Exceptional 57.6% |
Demographics Similar to Immigrants from Scotland by 2 or more Vehicles in Household
In terms of 2 or more vehicles in household, the demographic groups most similar to Immigrants from Scotland are Spanish American (58.9%, a difference of 0.020%), French Canadian (58.9%, a difference of 0.050%), Afghan (59.0%, a difference of 0.18%), Osage (58.8%, a difference of 0.18%), and Chickasaw (59.0%, a difference of 0.19%).
| Demographics | Rating | Rank | 2 or more Vehicles in Household |
| Spaniards | 99.9 /100 | #51 | Exceptional 59.2% |
| Immigrants | Laos | 99.9 /100 | #52 | Exceptional 59.2% |
| Celtics | 99.9 /100 | #53 | Exceptional 59.2% |
| Bhutanese | 99.9 /100 | #54 | Exceptional 59.1% |
| Luxembourgers | 99.9 /100 | #55 | Exceptional 59.1% |
| Chickasaw | 99.9 /100 | #56 | Exceptional 59.0% |
| Afghans | 99.9 /100 | #57 | Exceptional 59.0% |
| Immigrants | Scotland | 99.8 /100 | #58 | Exceptional 58.9% |
| Spanish Americans | 99.8 /100 | #59 | Exceptional 58.9% |
| French Canadians | 99.8 /100 | #60 | Exceptional 58.9% |
| Osage | 99.8 /100 | #61 | Exceptional 58.8% |
| Immigrants | Nonimmigrants | 99.8 /100 | #62 | Exceptional 58.8% |
| Mexican American Indians | 99.8 /100 | #63 | Exceptional 58.7% |
| Portuguese | 99.7 /100 | #64 | Exceptional 58.6% |
| Immigrants | Central America | 99.7 /100 | #65 | Exceptional 58.6% |