Iranian vs Senegalese 2 or more Vehicles in Household
COMPARE
Iranian
Senegalese
2 or more Vehicles in Household
2 or more Vehicles in Household Comparison
Iranians
Senegalese
58.1%
2 OR MORE VEHICLES IN HOUSEHOLD
99.3/ 100
METRIC RATING
82nd/ 347
METRIC RANK
44.2%
2 OR MORE VEHICLES IN HOUSEHOLD
0.0/ 100
METRIC RATING
322nd/ 347
METRIC RANK
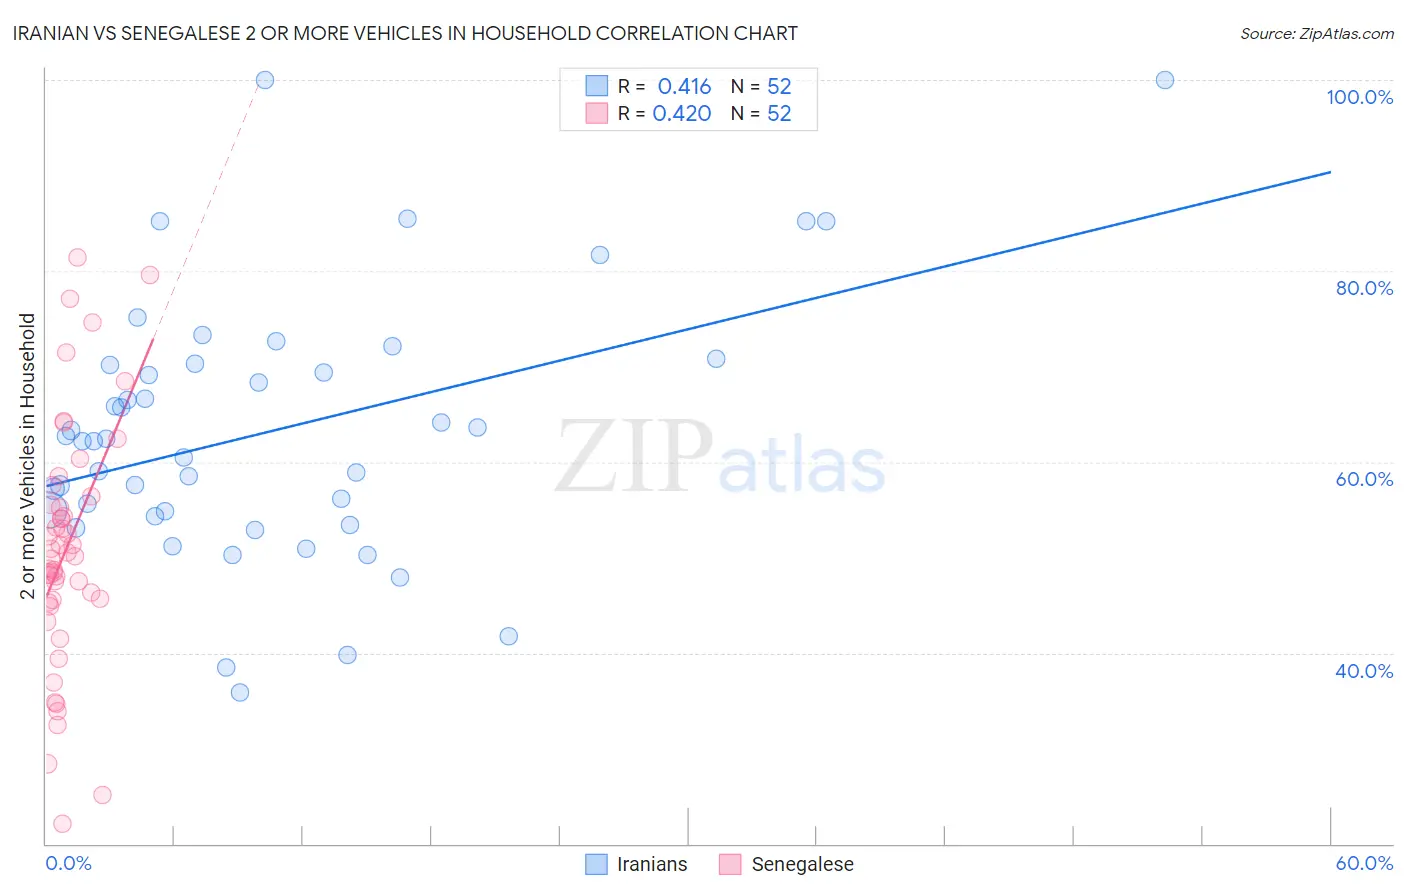
Iranian vs Senegalese 2 or more Vehicles in Household Correlation Chart
The statistical analysis conducted on geographies consisting of 316,668,802 people shows a moderate positive correlation between the proportion of Iranians and percentage of households with 2 or more vehicles available in the United States with a correlation coefficient (R) of 0.416 and weighted average of 58.1%. Similarly, the statistical analysis conducted on geographies consisting of 78,083,411 people shows a moderate positive correlation between the proportion of Senegalese and percentage of households with 2 or more vehicles available in the United States with a correlation coefficient (R) of 0.420 and weighted average of 44.2%, a difference of 31.3%.
2 or more Vehicles in Household Correlation Summary
| Measurement | Iranian | Senegalese |
| Minimum | 35.8% | 22.1% |
| Maximum | 100.0% | 81.4% |
| Range | 64.2% | 59.3% |
| Mean | 63.3% | 51.0% |
| Median | 62.3% | 50.3% |
| Interquartile 25% (IQ1) | 54.6% | 45.5% |
| Interquartile 75% (IQ3) | 70.2% | 56.0% |
| Interquartile Range (IQR) | 15.7% | 10.5% |
| Standard Deviation (Sample) | 13.8% | 12.8% |
| Standard Deviation (Population) | 13.7% | 12.7% |
Similar Demographics by 2 or more Vehicles in Household
Demographics Similar to Iranians by 2 or more Vehicles in Household
In terms of 2 or more vehicles in household, the demographic groups most similar to Iranians are Icelander (58.0%, a difference of 0.040%), Maltese (58.0%, a difference of 0.070%), Immigrants from Iraq (58.1%, a difference of 0.080%), Immigrants from England (58.1%, a difference of 0.10%), and Slovak (58.0%, a difference of 0.13%).
| Demographics | Rating | Rank | 2 or more Vehicles in Household |
| Poles | 99.5 /100 | #75 | Exceptional 58.3% |
| Creek | 99.5 /100 | #76 | Exceptional 58.3% |
| Slovenes | 99.5 /100 | #77 | Exceptional 58.3% |
| Lithuanians | 99.5 /100 | #78 | Exceptional 58.2% |
| Delaware | 99.4 /100 | #79 | Exceptional 58.2% |
| Immigrants | England | 99.3 /100 | #80 | Exceptional 58.1% |
| Immigrants | Iraq | 99.3 /100 | #81 | Exceptional 58.1% |
| Iranians | 99.3 /100 | #82 | Exceptional 58.1% |
| Icelanders | 99.2 /100 | #83 | Exceptional 58.0% |
| Maltese | 99.2 /100 | #84 | Exceptional 58.0% |
| Slovaks | 99.2 /100 | #85 | Exceptional 58.0% |
| Potawatomi | 99.1 /100 | #86 | Exceptional 58.0% |
| Thais | 99.1 /100 | #87 | Exceptional 57.9% |
| Immigrants | Iran | 99.1 /100 | #88 | Exceptional 57.9% |
| Immigrants | Germany | 99.0 /100 | #89 | Exceptional 57.9% |
Demographics Similar to Senegalese by 2 or more Vehicles in Household
In terms of 2 or more vehicles in household, the demographic groups most similar to Senegalese are Immigrants from Caribbean (44.2%, a difference of 0.020%), Immigrants from Jamaica (44.5%, a difference of 0.55%), Immigrants from Cabo Verde (43.3%, a difference of 2.1%), Immigrants from West Indies (43.1%, a difference of 2.6%), and Immigrants from Senegal (43.0%, a difference of 2.8%).
| Demographics | Rating | Rank | 2 or more Vehicles in Household |
| Puerto Ricans | 0.0 /100 | #315 | Tragic 47.1% |
| Cape Verdeans | 0.0 /100 | #316 | Tragic 46.8% |
| Immigrants | Haiti | 0.0 /100 | #317 | Tragic 46.5% |
| Immigrants | Albania | 0.0 /100 | #318 | Tragic 46.0% |
| Jamaicans | 0.0 /100 | #319 | Tragic 45.8% |
| Soviet Union | 0.0 /100 | #320 | Tragic 45.7% |
| Immigrants | Jamaica | 0.0 /100 | #321 | Tragic 44.5% |
| Senegalese | 0.0 /100 | #322 | Tragic 44.2% |
| Immigrants | Caribbean | 0.0 /100 | #323 | Tragic 44.2% |
| Immigrants | Cabo Verde | 0.0 /100 | #324 | Tragic 43.3% |
| Immigrants | West Indies | 0.0 /100 | #325 | Tragic 43.1% |
| Immigrants | Senegal | 0.0 /100 | #326 | Tragic 43.0% |
| Immigrants | Yemen | 0.0 /100 | #327 | Tragic 42.8% |
| Inupiat | 0.0 /100 | #328 | Tragic 42.6% |
| Ecuadorians | 0.0 /100 | #329 | Tragic 42.0% |