Iranian vs Hmong 2 or more Vehicles in Household

COMPARE

Iranian
Race
Ancestry
AfghanAfricanAlaska NativeAlaskan AthabascanAlbanianAleutAlsatianAmericanApacheArabArapahoArgentineanArmenianAssyrian/Chaldean/SyriacAustralianAustrianBahamianBangladeshiBarbadianBasqueBelgianBelizeanBermudanBhutaneseBlackfeetBolivianBrazilianBritishBritish West IndianBulgarianBurmeseCajunCambodianCanadianCape VerdeanCarpatho RusynCelticCentral AmericanCentral American IndianCherokeeCheyenneChickasawChileanChineseChippewaChoctawColombianColvilleComancheCosta RicanCreeCreekCroatianCrowCubanCypriotCzechCzechoslovakianDanishDelawareDominicanDutchDutch West IndianEastern EuropeanEcuadorianEgyptianEnglishEstonianEthiopianEuropeanFijianFilipinoFinnishFrenchFrench American IndianFrench CanadianGermanGerman RussianGhanaianGreekGuamanian/ChamorroGuatemalanGuyaneseHaitianHonduranHopiHoumaHungarianIcelanderIndian (Asian)IndonesianInupiatIranianIraqiIrishIroquoisIsraeliItalianJamaicanJapaneseJordanianKenyanKiowaKoreanLaotianLatvianLebaneseLiberianLithuanianLumbeeLuxembourgerMacedonianMalaysianMalteseMarshalleseMenomineeMexicanMexican American IndianMongolianMoroccanNative HawaiianNavajoNepaleseNew ZealanderNicaraguanNigerianNorthern EuropeanNorwegianOkinawanOsageOttawaPaiutePakistaniPalestinianPanamanianParaguayanPennsylvania GermanPeruvianPimaPolishPortuguesePotawatomiPuebloPuerto RicanPuget Sound SalishRomanianRussianSalvadoranSamoanScandinavianScotch-IrishScottishSeminoleSenegaleseSerbianShoshoneSierra LeoneanSiouxSlavicSlovakSloveneSomaliSouth AfricanSouth AmericanSouth American IndianSoviet UnionSpaniardSpanishSpanish AmericanSpanish American IndianSri LankanSubsaharan AfricanSudaneseSwedishSwissSyrianTaiwaneseThaiTlingit-HaidaTohono O'OdhamTonganTrinidadian and TobagonianTsimshianTurkishU.S. Virgin IslanderUgandanUkrainianUruguayanUteVenezuelanVietnameseWelshWest IndianYakamaYaquiYugoslavianYumanYup'ikZimbabwean
Immigration
NonimmigrantsImmigrantsAfghanistanAfricaAlbaniaArgentinaArmeniaAsiaAustraliaAustriaBahamasBangladeshBarbadosBelarusBelgiumBelizeBoliviaBosnia and HerzegovinaBrazilBulgariaBurma/MyanmarCabo VerdeCambodiaCameroonCanadaCaribbeanCentral AmericaChileChinaColombiaCongoCosta RicaCroatiaCubaCzechoslovakiaDenmarkDominicaDominican RepublicEastern AfricaEastern AsiaEastern EuropeEcuadorEgyptEl SalvadorEnglandEritreaEthiopiaEuropeFijiFranceGermanyGhanaGreeceGrenadaGuatemalaGuyanaHaitiHondurasHong KongHungaryIndiaIndonesiaIranIraqIrelandIsraelItalyJamaicaJapanJordanKazakhstanKenyaKoreaKuwaitLaosLatin AmericaLatviaLebanonLiberiaLithuaniaMalaysiaMexicoMicronesiaMiddle AfricaMoldovaMoroccoNepalNetherlandsNicaraguaNigeriaNorth AmericaNorth MacedoniaNorthern AfricaNorthern EuropeNorwayOceaniaPakistanPanamaPeruPhilippinesPolandPortugalRomaniaRussiaSaudi ArabiaScotlandSenegalSerbiaSierra LeoneSingaporeSomaliaSouth AfricaSouth AmericaSouth Central AsiaSouth Eastern AsiaSouthern EuropeSpainSri LankaSt. Vincent and the GrenadinesSudanSwedenSwitzerlandSyriaTaiwanThailandTrinidad and TobagoTurkeyUgandaUkraineUruguayUzbekistanVenezuelaVietnamWest IndiesWestern AfricaWestern AsiaWestern EuropeYemenZaireZimbabweAzores
Hmong
Race
Ancestry
AfghanAfricanAlaska NativeAlaskan AthabascanAlbanianAleutAlsatianAmericanApacheArabArapahoArgentineanArmenianAssyrian/Chaldean/SyriacAustralianAustrianBahamianBangladeshiBarbadianBasqueBelgianBelizeanBermudanBhutaneseBlackfeetBolivianBrazilianBritishBritish West IndianBulgarianBurmeseCajunCambodianCanadianCape VerdeanCarpatho RusynCelticCentral AmericanCentral American IndianCherokeeCheyenneChickasawChileanChineseChippewaChoctawColombianColvilleComancheCosta RicanCreeCreekCroatianCrowCubanCypriotCzechCzechoslovakianDanishDelawareDominicanDutchDutch West IndianEastern EuropeanEcuadorianEgyptianEnglishEstonianEthiopianEuropeanFijianFilipinoFinnishFrenchFrench American IndianFrench CanadianGermanGerman RussianGhanaianGreekGuamanian/ChamorroGuatemalanGuyaneseHaitianHmongHonduranHopiHoumaHungarianIcelanderIndian (Asian)IndonesianInupiatIraqiIrishIroquoisIsraeliItalianJamaicanJapaneseJordanianKenyanKiowaKoreanLaotianLatvianLebaneseLiberianLithuanianLumbeeLuxembourgerMacedonianMalaysianMalteseMarshalleseMenomineeMexicanMexican American IndianMongolianMoroccanNative HawaiianNavajoNepaleseNew ZealanderNicaraguanNigerianNorthern EuropeanNorwegianOkinawanOsageOttawaPaiutePakistaniPalestinianPanamanianParaguayanPennsylvania GermanPeruvianPimaPolishPortuguesePotawatomiPuebloPuerto RicanPuget Sound SalishRomanianRussianSalvadoranSamoanScandinavianScotch-IrishScottishSeminoleSenegaleseSerbianShoshoneSierra LeoneanSiouxSlavicSlovakSloveneSomaliSouth AfricanSouth AmericanSouth American IndianSoviet UnionSpaniardSpanishSpanish AmericanSpanish American IndianSri LankanSubsaharan AfricanSudaneseSwedishSwissSyrianTaiwaneseThaiTlingit-HaidaTohono O'OdhamTonganTrinidadian and TobagonianTsimshianTurkishU.S. Virgin IslanderUgandanUkrainianUruguayanUteVenezuelanVietnameseWelshWest IndianYakamaYaquiYugoslavianYumanYup'ikZimbabwean
Immigration
NonimmigrantsImmigrantsAfghanistanAfricaAlbaniaArgentinaArmeniaAsiaAustraliaAustriaBahamasBangladeshBarbadosBelarusBelgiumBelizeBoliviaBosnia and HerzegovinaBrazilBulgariaBurma/MyanmarCabo VerdeCambodiaCameroonCanadaCaribbeanCentral AmericaChileChinaColombiaCongoCosta RicaCroatiaCubaCzechoslovakiaDenmarkDominicaDominican RepublicEastern AfricaEastern AsiaEastern EuropeEcuadorEgyptEl SalvadorEnglandEritreaEthiopiaEuropeFijiFranceGermanyGhanaGreeceGrenadaGuatemalaGuyanaHaitiHondurasHong KongHungaryIndiaIndonesiaIranIraqIrelandIsraelItalyJamaicaJapanJordanKazakhstanKenyaKoreaKuwaitLaosLatin AmericaLatviaLebanonLiberiaLithuaniaMalaysiaMexicoMicronesiaMiddle AfricaMoldovaMoroccoNepalNetherlandsNicaraguaNigeriaNorth AmericaNorth MacedoniaNorthern AfricaNorthern EuropeNorwayOceaniaPakistanPanamaPeruPhilippinesPolandPortugalRomaniaRussiaSaudi ArabiaScotlandSenegalSerbiaSierra LeoneSingaporeSomaliaSouth AfricaSouth AmericaSouth Central AsiaSouth Eastern AsiaSouthern EuropeSpainSri LankaSt. Vincent and the GrenadinesSudanSwedenSwitzerlandSyriaTaiwanThailandTrinidad and TobagoTurkeyUgandaUkraineUruguayUzbekistanVenezuelaVietnamWest IndiesWestern AfricaWestern AsiaWestern EuropeYemenZaireZimbabweAzores
2 or more Vehicles in Household
Income
Poverty
Unemployment
Labor Participation
Family Structure
Vehicle Availability
Education Level
Disability

2 or more Vehicles in Household Comparison

Iranians

Hmong

Exceptional
Exceptional
58.1%
2 OR MORE VEHICLES IN HOUSEHOLD
99.3/ 100
METRIC RATING
82nd/ 347
METRIC RANK
57.8%
2 OR MORE VEHICLES IN HOUSEHOLD
98.9/ 100
METRIC RATING
95th/ 347
METRIC RANK

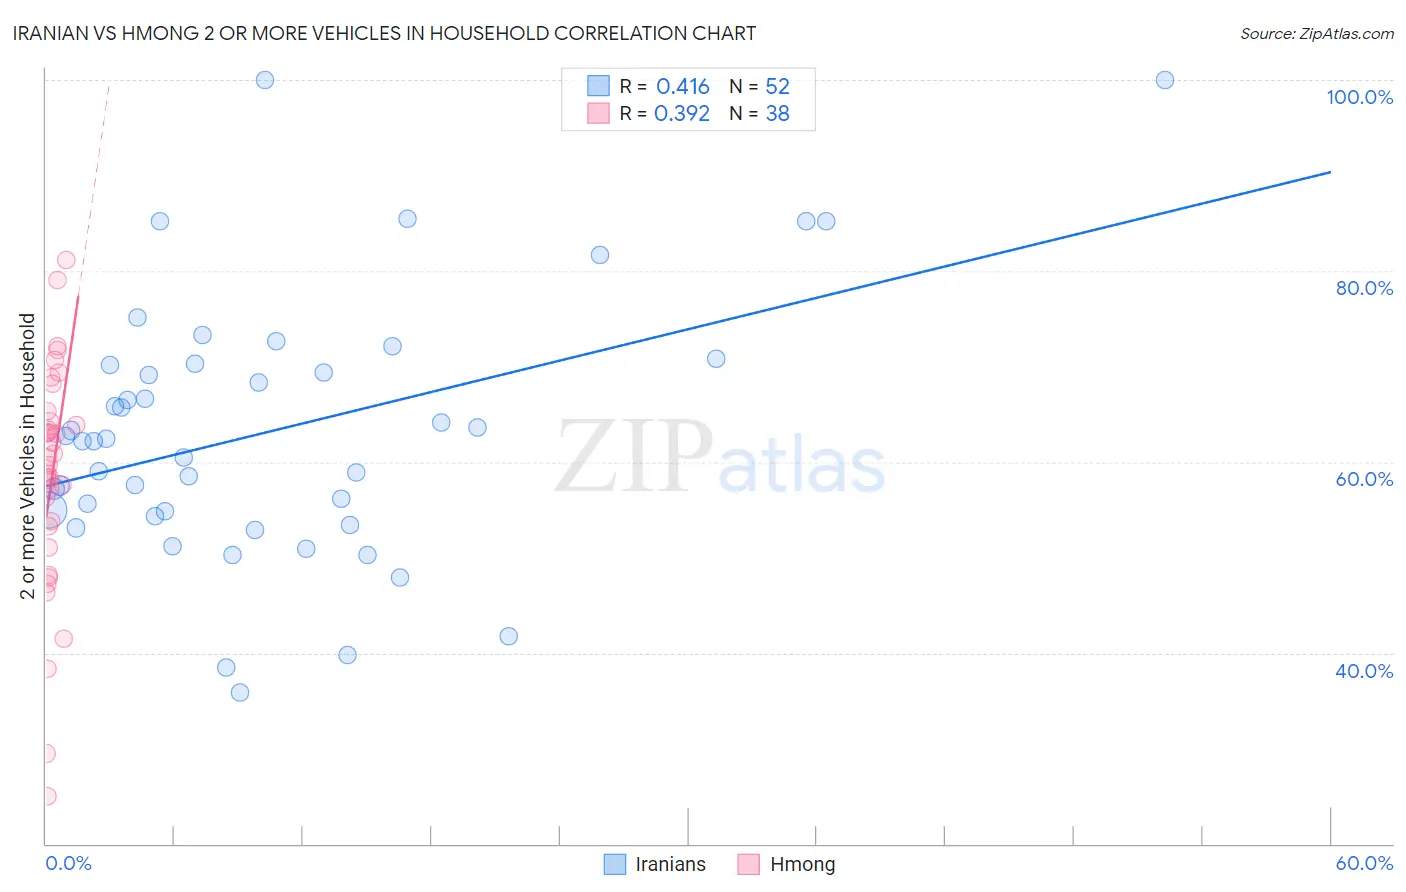
Iranian vs Hmong 2 or more Vehicles in Household Correlation Chart

The statistical analysis conducted on geographies consisting of 316,668,802 people shows a moderate positive correlation between the proportion of Iranians and percentage of households with 2 or more vehicles available in the United States with a correlation coefficient (R) of 0.416 and weighted average of 58.1%. Similarly, the statistical analysis conducted on geographies consisting of 24,669,739 people shows a mild positive correlation between the proportion of Hmong and percentage of households with 2 or more vehicles available in the United States with a correlation coefficient (R) of 0.392 and weighted average of 57.8%, a difference of 0.41%.
Iranian vs Hmong 2 or more Vehicles in Household

2 or more Vehicles in Household Correlation Summary

MeasurementIranianHmong
Minimum35.8%25.0%
Maximum100.0%81.2%
Range64.2%56.2%
Mean63.3%58.4%
Median62.3%60.0%
Interquartile 25% (IQ1)54.6%53.3%
Interquartile 75% (IQ3)70.2%64.2%
Interquartile Range (IQR)15.7%10.9%
Standard Deviation (Sample)13.8%11.9%
Standard Deviation (Population)13.7%11.8%

Demographics Similar to Iranians and Hmong by 2 or more Vehicles in Household

In terms of 2 or more vehicles in household, the demographic groups most similar to Iranians are Icelander (58.0%, a difference of 0.040%), Maltese (58.0%, a difference of 0.070%), Immigrants from Iraq (58.1%, a difference of 0.080%), Immigrants from England (58.1%, a difference of 0.10%), and Slovak (58.0%, a difference of 0.13%). Similarly, the demographic groups most similar to Hmong are Filipino (57.8%, a difference of 0.020%), Burmese (57.8%, a difference of 0.030%), Slavic (57.8%, a difference of 0.060%), Ottawa (57.9%, a difference of 0.080%), and Shoshone (57.9%, a difference of 0.090%).
DemographicsRating | Rank2 or more Vehicles in Household
Lithuanians
99.5
/100
|
#78
Exceptional
58.2%
Delaware
99.4
/100
|
#79
Exceptional
58.2%
Immigrants | England
99.3
/100
|
#80
Exceptional
58.1%
Immigrants | Iraq
99.3
/100
|
#81
Exceptional
58.1%
Iranians
99.3
/100
|
#82
Exceptional
58.1%
Icelanders
99.2
/100
|
#83
Exceptional
58.0%
Maltese
99.2
/100
|
#84
Exceptional
58.0%
Slovaks
99.2
/100
|
#85
Exceptional
58.0%
Potawatomi
99.1
/100
|
#86
Exceptional
58.0%
Thais
99.1
/100
|
#87
Exceptional
57.9%
Immigrants | Iran
99.1
/100
|
#88
Exceptional
57.9%
Immigrants | Germany
99.0
/100
|
#89
Exceptional
57.9%
Hispanics or Latinos
99.0
/100
|
#90
Exceptional
57.9%
Pakistanis
99.0
/100
|
#91
Exceptional
57.9%
Shoshone
99.0
/100
|
#92
Exceptional
57.9%
Ottawa
99.0
/100
|
#93
Exceptional
57.9%
Filipinos
98.9
/100
|
#94
Exceptional
57.8%
Hmong
98.9
/100
|
#95
Exceptional
57.8%
Burmese
98.8
/100
|
#96
Exceptional
57.8%
Slavs
98.8
/100
|
#97
Exceptional
57.8%
Palestinians
98.6
/100
|
#98
Exceptional
57.7%