Immigrants from El Salvador vs Cypriot 3 or more Vehicles in Household
COMPARE
Immigrants from El Salvador
Cypriot
3 or more Vehicles in Household
3 or more Vehicles in Household Comparison
Immigrants from El Salvador
Cypriots
21.5%
3 OR MORE VEHICLES IN HOUSEHOLD
99.6/ 100
METRIC RATING
82nd/ 347
METRIC RANK
16.6%
3 OR MORE VEHICLES IN HOUSEHOLD
0.0/ 100
METRIC RATING
300th/ 347
METRIC RANK
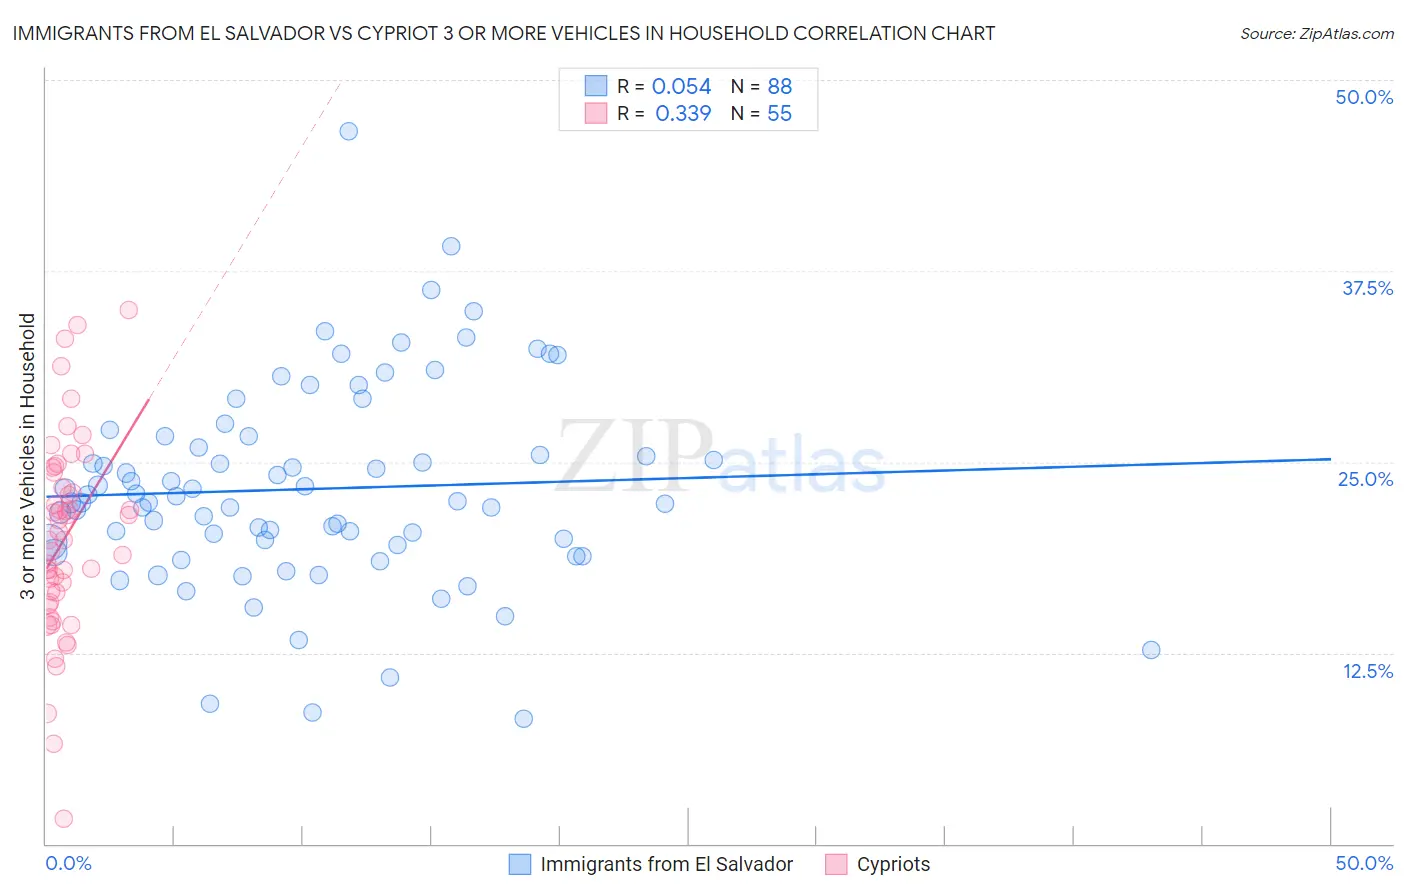
Immigrants from El Salvador vs Cypriot 3 or more Vehicles in Household Correlation Chart
The statistical analysis conducted on geographies consisting of 357,687,978 people shows a slight positive correlation between the proportion of Immigrants from El Salvador and percentage of households with 3 or more vehicles available in the United States with a correlation coefficient (R) of 0.054 and weighted average of 21.5%. Similarly, the statistical analysis conducted on geographies consisting of 61,836,618 people shows a mild positive correlation between the proportion of Cypriots and percentage of households with 3 or more vehicles available in the United States with a correlation coefficient (R) of 0.339 and weighted average of 16.6%, a difference of 29.5%.
3 or more Vehicles in Household Correlation Summary
| Measurement | Immigrants from El Salvador | Cypriot |
| Minimum | 8.2% | 1.6% |
| Maximum | 46.7% | 34.9% |
| Range | 38.5% | 33.3% |
| Mean | 23.2% | 20.0% |
| Median | 22.4% | 19.9% |
| Interquartile 25% (IQ1) | 19.7% | 15.8% |
| Interquartile 75% (IQ3) | 26.3% | 24.3% |
| Interquartile Range (IQR) | 6.7% | 8.5% |
| Standard Deviation (Sample) | 6.6% | 6.5% |
| Standard Deviation (Population) | 6.6% | 6.4% |
Similar Demographics by 3 or more Vehicles in Household
Demographics Similar to Immigrants from El Salvador by 3 or more Vehicles in Household
In terms of 3 or more vehicles in household, the demographic groups most similar to Immigrants from El Salvador are Chippewa (21.5%, a difference of 0.030%), Icelander (21.5%, a difference of 0.080%), Laotian (21.5%, a difference of 0.10%), Delaware (21.5%, a difference of 0.17%), and Immigrants from the Azores (21.5%, a difference of 0.29%).
| Demographics | Rating | Rank | 3 or more Vehicles in Household |
| Japanese | 99.8 /100 | #75 | Exceptional 21.8% |
| Immigrants | Nonimmigrants | 99.8 /100 | #76 | Exceptional 21.8% |
| Irish | 99.8 /100 | #77 | Exceptional 21.8% |
| Czechoslovakians | 99.8 /100 | #78 | Exceptional 21.7% |
| Assyrians/Chaldeans/Syriacs | 99.8 /100 | #79 | Exceptional 21.7% |
| Afghans | 99.7 /100 | #80 | Exceptional 21.7% |
| Celtics | 99.7 /100 | #81 | Exceptional 21.7% |
| Immigrants | El Salvador | 99.6 /100 | #82 | Exceptional 21.5% |
| Chippewa | 99.6 /100 | #83 | Exceptional 21.5% |
| Icelanders | 99.6 /100 | #84 | Exceptional 21.5% |
| Laotians | 99.6 /100 | #85 | Exceptional 21.5% |
| Delaware | 99.6 /100 | #86 | Exceptional 21.5% |
| Immigrants | Azores | 99.5 /100 | #87 | Exceptional 21.5% |
| French | 99.4 /100 | #88 | Exceptional 21.4% |
| Marshallese | 99.2 /100 | #89 | Exceptional 21.3% |
Demographics Similar to Cypriots by 3 or more Vehicles in Household
In terms of 3 or more vehicles in household, the demographic groups most similar to Cypriots are Paraguayan (16.6%, a difference of 0.41%), Immigrants from South America (16.7%, a difference of 0.48%), Immigrants from Zaire (16.7%, a difference of 0.54%), Immigrants from Greece (16.5%, a difference of 0.83%), and Israeli (16.8%, a difference of 0.91%).
| Demographics | Rating | Rank | 3 or more Vehicles in Household |
| Bahamians | 0.1 /100 | #293 | Tragic 16.9% |
| Immigrants | Western Africa | 0.1 /100 | #294 | Tragic 16.9% |
| Immigrants | Russia | 0.1 /100 | #295 | Tragic 16.9% |
| Inupiat | 0.1 /100 | #296 | Tragic 16.9% |
| Israelis | 0.1 /100 | #297 | Tragic 16.8% |
| Immigrants | Zaire | 0.1 /100 | #298 | Tragic 16.7% |
| Immigrants | South America | 0.1 /100 | #299 | Tragic 16.7% |
| Cypriots | 0.0 /100 | #300 | Tragic 16.6% |
| Paraguayans | 0.0 /100 | #301 | Tragic 16.6% |
| Immigrants | Greece | 0.0 /100 | #302 | Tragic 16.5% |
| Immigrants | Serbia | 0.0 /100 | #303 | Tragic 16.4% |
| Ghanaians | 0.0 /100 | #304 | Tragic 16.4% |
| Immigrants | Morocco | 0.0 /100 | #305 | Tragic 16.3% |
| Somalis | 0.0 /100 | #306 | Tragic 16.2% |
| Immigrants | Ghana | 0.0 /100 | #307 | Tragic 16.2% |