Immigrants from Kenya vs Cypriot 3 or more Vehicles in Household
COMPARE
Immigrants from Kenya
Cypriot
3 or more Vehicles in Household
3 or more Vehicles in Household Comparison
Immigrants from Kenya
Cypriots
18.8%
3 OR MORE VEHICLES IN HOUSEHOLD
12.4/ 100
METRIC RATING
211th/ 347
METRIC RANK
16.6%
3 OR MORE VEHICLES IN HOUSEHOLD
0.0/ 100
METRIC RATING
300th/ 347
METRIC RANK
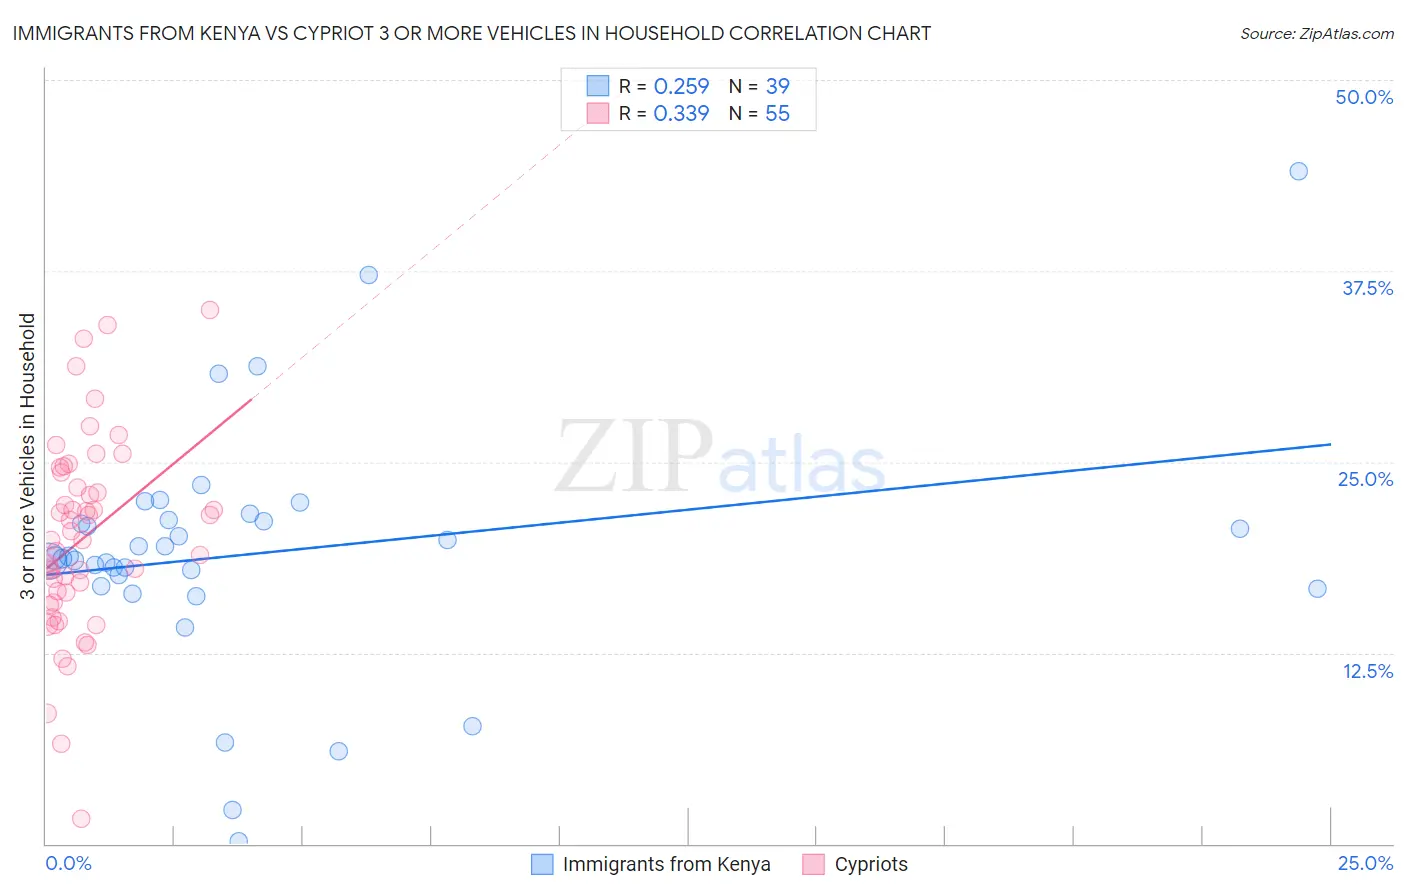
Immigrants from Kenya vs Cypriot 3 or more Vehicles in Household Correlation Chart
The statistical analysis conducted on geographies consisting of 217,959,739 people shows a weak positive correlation between the proportion of Immigrants from Kenya and percentage of households with 3 or more vehicles available in the United States with a correlation coefficient (R) of 0.259 and weighted average of 18.8%. Similarly, the statistical analysis conducted on geographies consisting of 61,836,618 people shows a mild positive correlation between the proportion of Cypriots and percentage of households with 3 or more vehicles available in the United States with a correlation coefficient (R) of 0.339 and weighted average of 16.6%, a difference of 13.0%.
3 or more Vehicles in Household Correlation Summary
| Measurement | Immigrants from Kenya | Cypriot |
| Minimum | 0.19% | 1.6% |
| Maximum | 44.0% | 34.9% |
| Range | 43.8% | 33.3% |
| Mean | 19.1% | 20.0% |
| Median | 18.7% | 19.9% |
| Interquartile 25% (IQ1) | 16.9% | 15.8% |
| Interquartile 75% (IQ3) | 21.2% | 24.3% |
| Interquartile Range (IQR) | 4.3% | 8.5% |
| Standard Deviation (Sample) | 8.1% | 6.5% |
| Standard Deviation (Population) | 8.0% | 6.4% |
Similar Demographics by 3 or more Vehicles in Household
Demographics Similar to Immigrants from Kenya by 3 or more Vehicles in Household
In terms of 3 or more vehicles in household, the demographic groups most similar to Immigrants from Kenya are Bulgarian (18.8%, a difference of 0.12%), Panamanian (18.8%, a difference of 0.14%), Immigrants from Cuba (18.8%, a difference of 0.15%), Immigrants from Egypt (18.8%, a difference of 0.20%), and Immigrants from Chile (18.8%, a difference of 0.21%).
| Demographics | Rating | Rank | 3 or more Vehicles in Household |
| Immigrants | Romania | 14.6 /100 | #204 | Poor 18.9% |
| Russians | 14.2 /100 | #205 | Poor 18.8% |
| Immigrants | Eastern Asia | 14.1 /100 | #206 | Poor 18.8% |
| Immigrants | Chile | 13.6 /100 | #207 | Poor 18.8% |
| Immigrants | Burma/Myanmar | 13.6 /100 | #208 | Poor 18.8% |
| Immigrants | Egypt | 13.5 /100 | #209 | Poor 18.8% |
| Bulgarians | 13.1 /100 | #210 | Poor 18.8% |
| Immigrants | Kenya | 12.4 /100 | #211 | Poor 18.8% |
| Panamanians | 11.6 /100 | #212 | Poor 18.8% |
| Immigrants | Cuba | 11.6 /100 | #213 | Poor 18.8% |
| Immigrants | Sierra Leone | 10.8 /100 | #214 | Poor 18.7% |
| Eastern Europeans | 10.6 /100 | #215 | Poor 18.7% |
| Immigrants | Nigeria | 10.3 /100 | #216 | Poor 18.7% |
| Immigrants | Italy | 10.2 /100 | #217 | Poor 18.7% |
| Immigrants | Portugal | 8.9 /100 | #218 | Tragic 18.6% |
Demographics Similar to Cypriots by 3 or more Vehicles in Household
In terms of 3 or more vehicles in household, the demographic groups most similar to Cypriots are Paraguayan (16.6%, a difference of 0.41%), Immigrants from South America (16.7%, a difference of 0.48%), Immigrants from Zaire (16.7%, a difference of 0.54%), Immigrants from Greece (16.5%, a difference of 0.83%), and Israeli (16.8%, a difference of 0.91%).
| Demographics | Rating | Rank | 3 or more Vehicles in Household |
| Bahamians | 0.1 /100 | #293 | Tragic 16.9% |
| Immigrants | Western Africa | 0.1 /100 | #294 | Tragic 16.9% |
| Immigrants | Russia | 0.1 /100 | #295 | Tragic 16.9% |
| Inupiat | 0.1 /100 | #296 | Tragic 16.9% |
| Israelis | 0.1 /100 | #297 | Tragic 16.8% |
| Immigrants | Zaire | 0.1 /100 | #298 | Tragic 16.7% |
| Immigrants | South America | 0.1 /100 | #299 | Tragic 16.7% |
| Cypriots | 0.0 /100 | #300 | Tragic 16.6% |
| Paraguayans | 0.0 /100 | #301 | Tragic 16.6% |
| Immigrants | Greece | 0.0 /100 | #302 | Tragic 16.5% |
| Immigrants | Serbia | 0.0 /100 | #303 | Tragic 16.4% |
| Ghanaians | 0.0 /100 | #304 | Tragic 16.4% |
| Immigrants | Morocco | 0.0 /100 | #305 | Tragic 16.3% |
| Somalis | 0.0 /100 | #306 | Tragic 16.2% |
| Immigrants | Ghana | 0.0 /100 | #307 | Tragic 16.2% |