Immigrants from Zaire vs Ute No Vehicles in Household
COMPARE
Immigrants from Zaire
Ute
No Vehicles in Household
No Vehicles in Household Comparison
Immigrants from Zaire
Ute
11.2%
NO VEHICLES IN HOUSEHOLD
9.6/ 100
METRIC RATING
220th/ 347
METRIC RANK
11.6%
NO VEHICLES IN HOUSEHOLD
3.3/ 100
METRIC RATING
237th/ 347
METRIC RANK
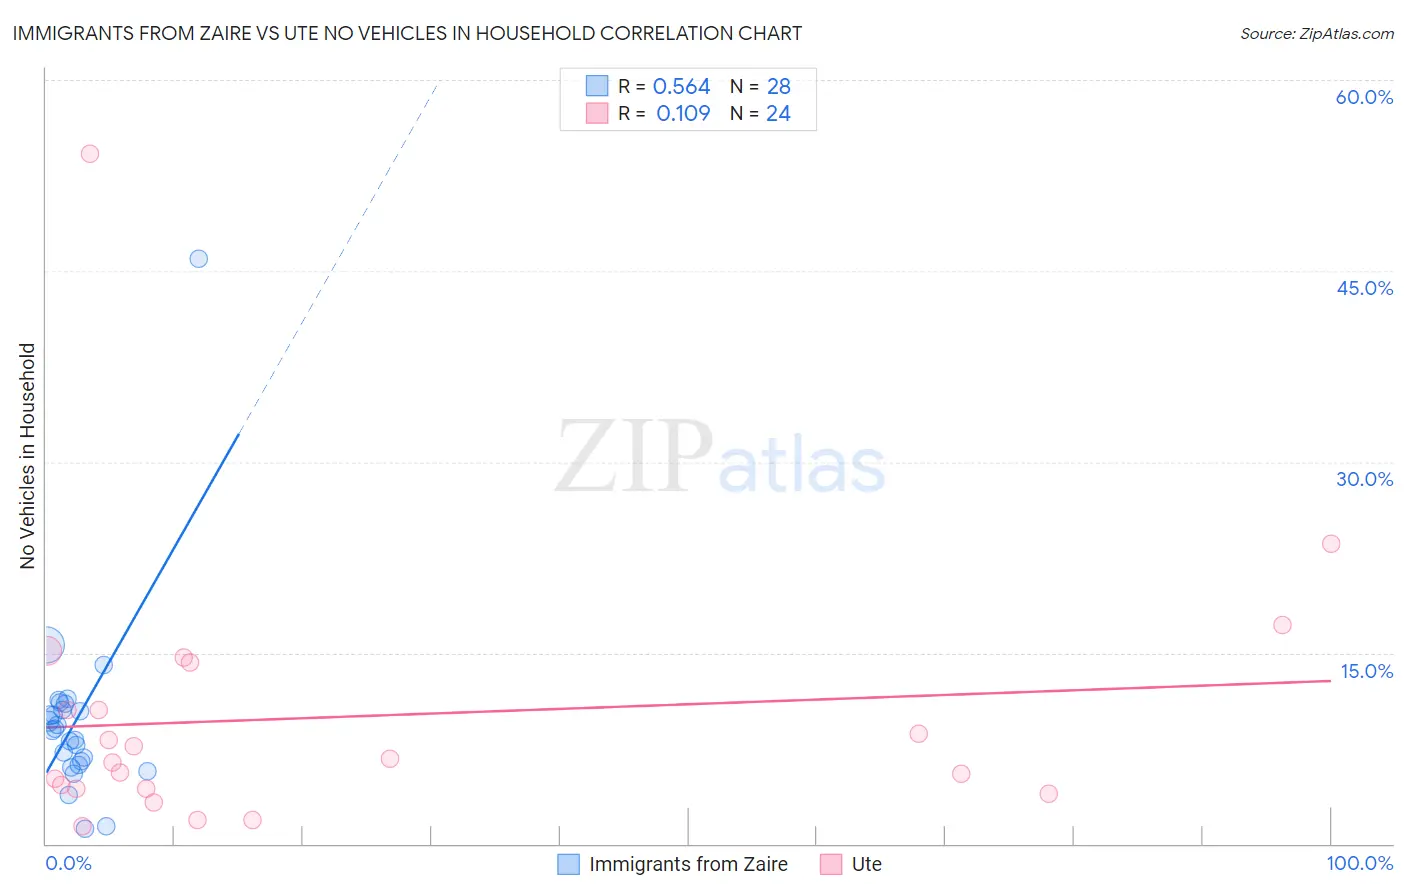
Immigrants from Zaire vs Ute No Vehicles in Household Correlation Chart
The statistical analysis conducted on geographies consisting of 107,219,948 people shows a substantial positive correlation between the proportion of Immigrants from Zaire and percentage of households with no vehicle available in the United States with a correlation coefficient (R) of 0.564 and weighted average of 11.2%. Similarly, the statistical analysis conducted on geographies consisting of 55,604,944 people shows a poor positive correlation between the proportion of Ute and percentage of households with no vehicle available in the United States with a correlation coefficient (R) of 0.109 and weighted average of 11.6%, a difference of 3.6%.
No Vehicles in Household Correlation Summary
| Measurement | Immigrants from Zaire | Ute |
| Minimum | 1.2% | 1.3% |
| Maximum | 46.0% | 54.2% |
| Range | 44.8% | 52.9% |
| Mean | 9.7% | 10.0% |
| Median | 9.0% | 6.5% |
| Interquartile 25% (IQ1) | 6.4% | 4.3% |
| Interquartile 75% (IQ3) | 10.8% | 12.4% |
| Interquartile Range (IQR) | 4.4% | 8.1% |
| Standard Deviation (Sample) | 7.8% | 10.9% |
| Standard Deviation (Population) | 7.7% | 10.7% |
Demographics Similar to Immigrants from Zaire and Ute by No Vehicles in Household
In terms of no vehicles in household, the demographic groups most similar to Immigrants from Zaire are Argentinean (11.2%, a difference of 0.010%), Immigrants from Guatemala (11.2%, a difference of 0.14%), Peruvian (11.2%, a difference of 0.45%), Immigrants from South America (11.3%, a difference of 0.60%), and Uruguayan (11.3%, a difference of 0.75%). Similarly, the demographic groups most similar to Ute are Russian (11.6%, a difference of 0.050%), Cree (11.6%, a difference of 0.24%), Kiowa (11.5%, a difference of 0.59%), Immigrants from Peru (11.5%, a difference of 0.97%), and Houma (11.5%, a difference of 1.2%).
| Demographics | Rating | Rank | No Vehicles in Household |
| Immigrants | Guatemala | 10.0 /100 | #218 | Tragic 11.2% |
| Argentineans | 9.6 /100 | #219 | Tragic 11.2% |
| Immigrants | Zaire | 9.6 /100 | #220 | Tragic 11.2% |
| Peruvians | 8.4 /100 | #221 | Tragic 11.2% |
| Immigrants | South America | 8.0 /100 | #222 | Tragic 11.3% |
| Uruguayans | 7.7 /100 | #223 | Tragic 11.3% |
| Immigrants | Hong Kong | 7.2 /100 | #224 | Tragic 11.3% |
| Immigrants | Sierra Leone | 6.4 /100 | #225 | Tragic 11.3% |
| Immigrants | Somalia | 5.4 /100 | #226 | Tragic 11.4% |
| Immigrants | Pakistan | 5.4 /100 | #227 | Tragic 11.4% |
| Immigrants | Romania | 5.3 /100 | #228 | Tragic 11.4% |
| Ugandans | 5.3 /100 | #229 | Tragic 11.4% |
| Immigrants | Norway | 5.1 /100 | #230 | Tragic 11.4% |
| Immigrants | Japan | 5.1 /100 | #231 | Tragic 11.4% |
| Immigrants | Turkey | 4.8 /100 | #232 | Tragic 11.5% |
| Houma | 4.7 /100 | #233 | Tragic 11.5% |
| Immigrants | Peru | 4.5 /100 | #234 | Tragic 11.5% |
| Kiowa | 4.0 /100 | #235 | Tragic 11.5% |
| Cree | 3.5 /100 | #236 | Tragic 11.6% |
| Ute | 3.3 /100 | #237 | Tragic 11.6% |
| Russians | 3.2 /100 | #238 | Tragic 11.6% |