Immigrants from Zaire vs Central American Indian 2 or more Vehicles in Household
COMPARE
Immigrants from Zaire
Central American Indian
2 or more Vehicles in Household
2 or more Vehicles in Household Comparison
Immigrants from Zaire
Central American Indians
51.5%
2 OR MORE VEHICLES IN HOUSEHOLD
0.1/ 100
METRIC RATING
284th/ 347
METRIC RANK
52.5%
2 OR MORE VEHICLES IN HOUSEHOLD
0.6/ 100
METRIC RATING
258th/ 347
METRIC RANK
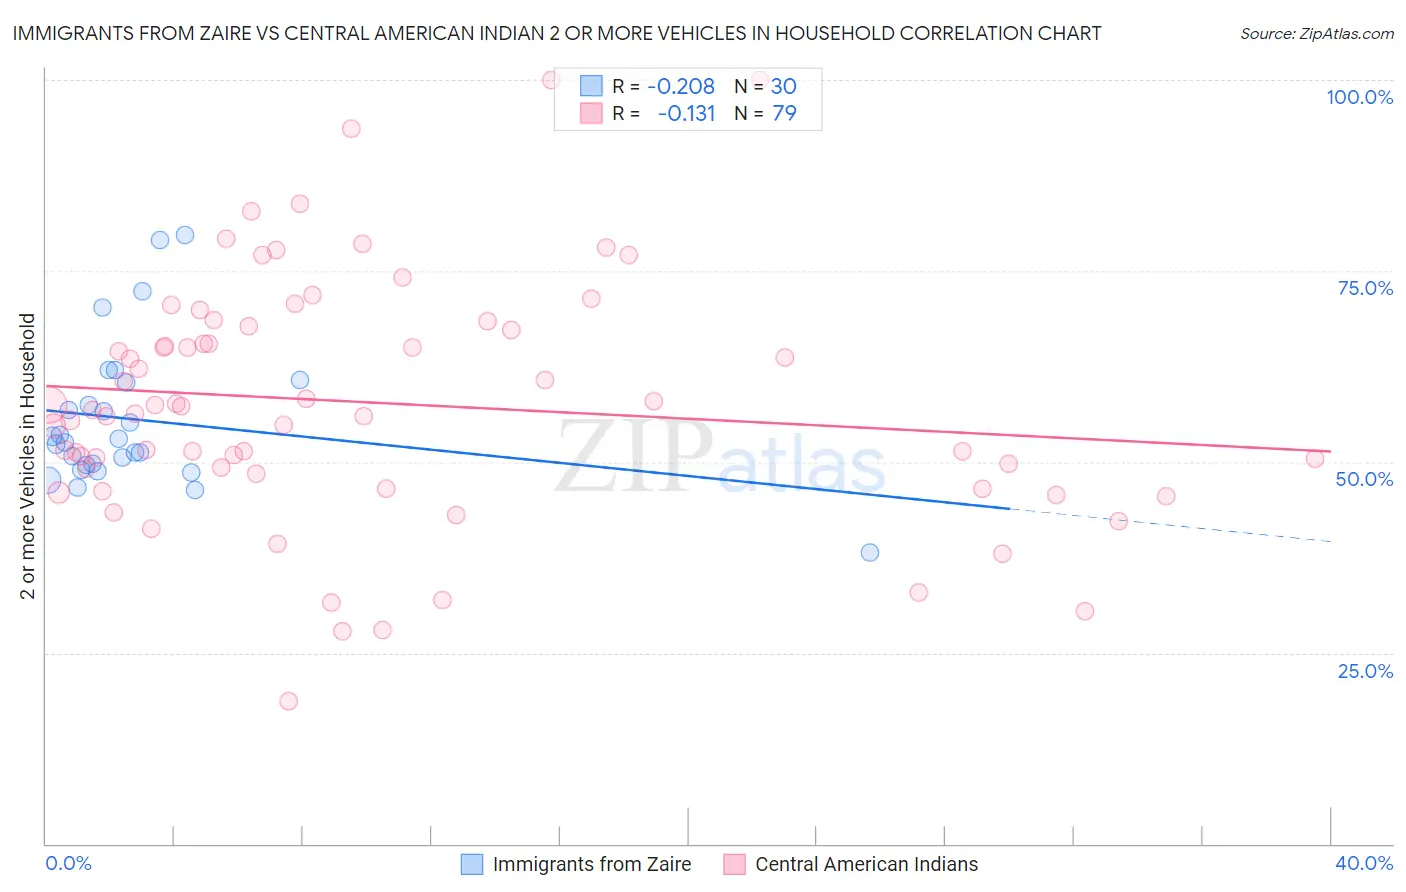
Immigrants from Zaire vs Central American Indian 2 or more Vehicles in Household Correlation Chart
The statistical analysis conducted on geographies consisting of 107,246,082 people shows a weak negative correlation between the proportion of Immigrants from Zaire and percentage of households with 2 or more vehicles available in the United States with a correlation coefficient (R) of -0.208 and weighted average of 51.5%. Similarly, the statistical analysis conducted on geographies consisting of 326,069,304 people shows a poor negative correlation between the proportion of Central American Indians and percentage of households with 2 or more vehicles available in the United States with a correlation coefficient (R) of -0.131 and weighted average of 52.5%, a difference of 2.0%.
2 or more Vehicles in Household Correlation Summary
| Measurement | Immigrants from Zaire | Central American Indian |
| Minimum | 38.1% | 18.7% |
| Maximum | 79.7% | 100.0% |
| Range | 41.6% | 81.3% |
| Mean | 55.5% | 57.8% |
| Median | 52.7% | 56.8% |
| Interquartile 25% (IQ1) | 49.5% | 48.5% |
| Interquartile 75% (IQ3) | 60.4% | 67.8% |
| Interquartile Range (IQR) | 10.8% | 19.3% |
| Standard Deviation (Sample) | 9.5% | 16.0% |
| Standard Deviation (Population) | 9.4% | 15.9% |
Similar Demographics by 2 or more Vehicles in Household
Demographics Similar to Immigrants from Zaire by 2 or more Vehicles in Household
In terms of 2 or more vehicles in household, the demographic groups most similar to Immigrants from Zaire are Immigrants from China (51.5%, a difference of 0.040%), Bahamian (51.5%, a difference of 0.12%), Immigrants from Uruguay (51.4%, a difference of 0.16%), Immigrants from Kazakhstan (51.6%, a difference of 0.18%), and Immigrants from Liberia (51.3%, a difference of 0.30%).
| Demographics | Rating | Rank | 2 or more Vehicles in Household |
| Immigrants | Africa | 0.2 /100 | #277 | Tragic 51.8% |
| Yuman | 0.1 /100 | #278 | Tragic 51.7% |
| Liberians | 0.1 /100 | #279 | Tragic 51.7% |
| Immigrants | Eastern Europe | 0.1 /100 | #280 | Tragic 51.7% |
| Immigrants | Kazakhstan | 0.1 /100 | #281 | Tragic 51.6% |
| Bahamians | 0.1 /100 | #282 | Tragic 51.5% |
| Immigrants | China | 0.1 /100 | #283 | Tragic 51.5% |
| Immigrants | Zaire | 0.1 /100 | #284 | Tragic 51.5% |
| Immigrants | Uruguay | 0.1 /100 | #285 | Tragic 51.4% |
| Immigrants | Liberia | 0.1 /100 | #286 | Tragic 51.3% |
| Immigrants | Serbia | 0.1 /100 | #287 | Tragic 51.3% |
| Okinawans | 0.1 /100 | #288 | Tragic 51.2% |
| Somalis | 0.0 /100 | #289 | Tragic 51.1% |
| Immigrants | Panama | 0.0 /100 | #290 | Tragic 51.1% |
| Belizeans | 0.0 /100 | #291 | Tragic 51.0% |
Demographics Similar to Central American Indians by 2 or more Vehicles in Household
In terms of 2 or more vehicles in household, the demographic groups most similar to Central American Indians are Alsatian (52.5%, a difference of 0.040%), Immigrants from Hong Kong (52.6%, a difference of 0.10%), Immigrants from Bahamas (52.5%, a difference of 0.10%), Immigrants from Australia (52.4%, a difference of 0.14%), and Immigrants from Eritrea (52.6%, a difference of 0.24%).
| Demographics | Rating | Rank | 2 or more Vehicles in Household |
| Immigrants | Sudan | 1.0 /100 | #251 | Tragic 52.8% |
| Immigrants | Portugal | 1.0 /100 | #252 | Tragic 52.8% |
| Nigerians | 0.9 /100 | #253 | Tragic 52.8% |
| Immigrants | Malaysia | 0.8 /100 | #254 | Tragic 52.7% |
| Uruguayans | 0.7 /100 | #255 | Tragic 52.7% |
| Immigrants | Eritrea | 0.7 /100 | #256 | Tragic 52.6% |
| Immigrants | Hong Kong | 0.6 /100 | #257 | Tragic 52.6% |
| Central American Indians | 0.6 /100 | #258 | Tragic 52.5% |
| Alsatians | 0.6 /100 | #259 | Tragic 52.5% |
| Immigrants | Bahamas | 0.5 /100 | #260 | Tragic 52.5% |
| Immigrants | Australia | 0.5 /100 | #261 | Tragic 52.4% |
| Immigrants | Northern Africa | 0.4 /100 | #262 | Tragic 52.3% |
| Immigrants | Southern Europe | 0.4 /100 | #263 | Tragic 52.3% |
| Immigrants | Latvia | 0.4 /100 | #264 | Tragic 52.2% |
| Immigrants | Congo | 0.3 /100 | #265 | Tragic 52.1% |