Immigrants from Canada vs South African 4 or more Vehicles in Household
COMPARE
Immigrants from Canada
South African
4 or more Vehicles in Household
4 or more Vehicles in Household Comparison
Immigrants from Canada
South Africans
6.5%
4 OR MORE VEHICLES IN HOUSEHOLD
78.6/ 100
METRIC RATING
143rd/ 347
METRIC RANK
6.2%
4 OR MORE VEHICLES IN HOUSEHOLD
32.2/ 100
METRIC RATING
190th/ 347
METRIC RANK
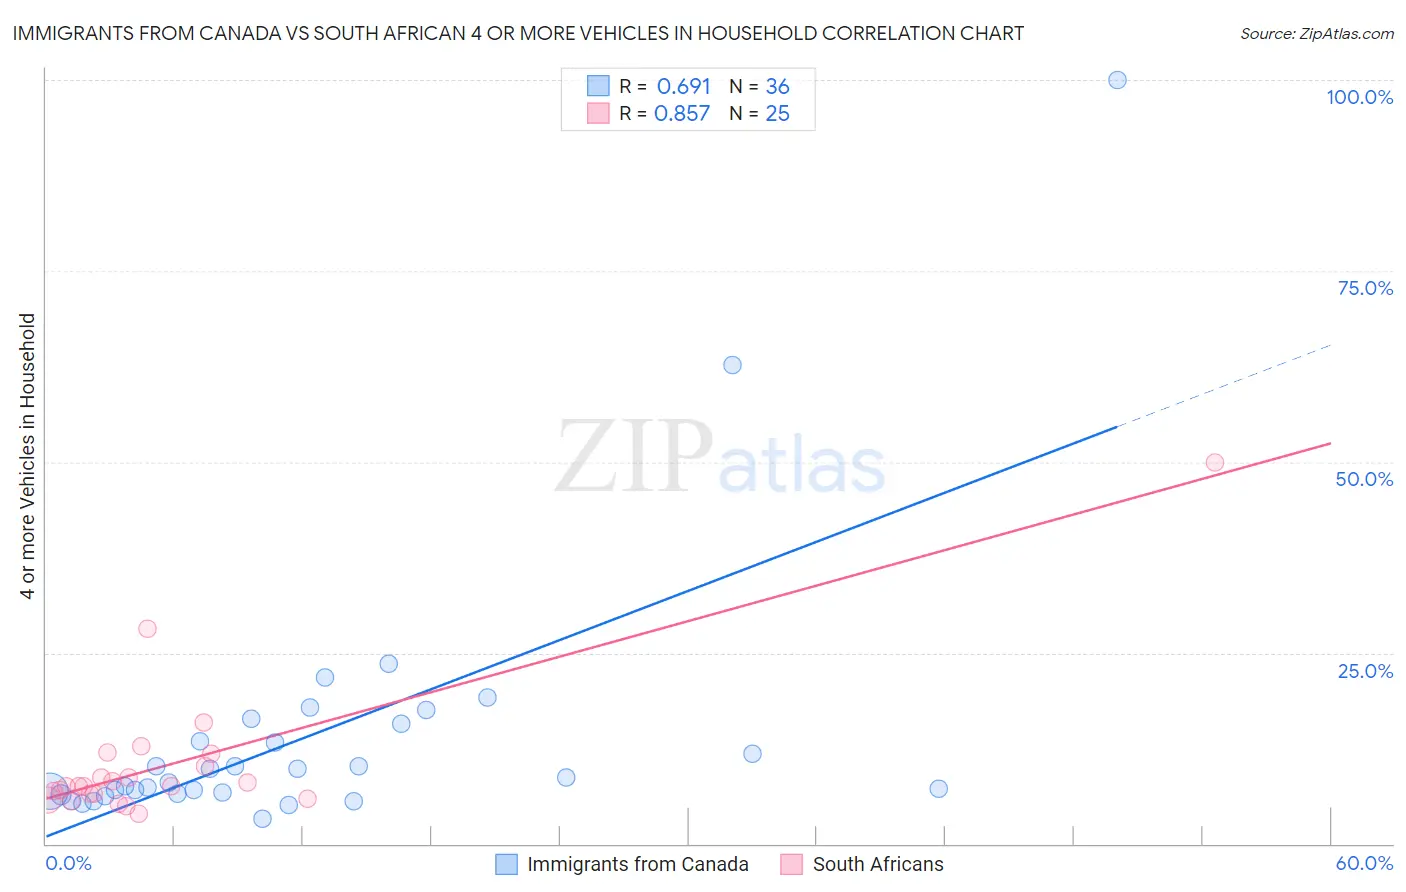
Immigrants from Canada vs South African 4 or more Vehicles in Household Correlation Chart
The statistical analysis conducted on geographies consisting of 457,196,725 people shows a significant positive correlation between the proportion of Immigrants from Canada and percentage of households with 4 or more vehicles available in the United States with a correlation coefficient (R) of 0.691 and weighted average of 6.5%. Similarly, the statistical analysis conducted on geographies consisting of 181,747,676 people shows a very strong positive correlation between the proportion of South Africans and percentage of households with 4 or more vehicles available in the United States with a correlation coefficient (R) of 0.857 and weighted average of 6.2%, a difference of 5.3%.
4 or more Vehicles in Household Correlation Summary
| Measurement | Immigrants from Canada | South African |
| Minimum | 3.3% | 3.9% |
| Maximum | 100.0% | 50.0% |
| Range | 96.7% | 46.1% |
| Mean | 14.1% | 10.5% |
| Median | 8.4% | 7.5% |
| Interquartile 25% (IQ1) | 6.7% | 6.2% |
| Interquartile 75% (IQ3) | 14.6% | 11.0% |
| Interquartile Range (IQR) | 7.9% | 4.8% |
| Standard Deviation (Sample) | 17.9% | 9.6% |
| Standard Deviation (Population) | 17.6% | 9.4% |
Similar Demographics by 4 or more Vehicles in Household
Demographics Similar to Immigrants from Canada by 4 or more Vehicles in Household
In terms of 4 or more vehicles in household, the demographic groups most similar to Immigrants from Canada are Immigrants from North America (6.5%, a difference of 0.020%), Croatian (6.5%, a difference of 0.11%), Immigrants from Iraq (6.5%, a difference of 0.13%), Australian (6.6%, a difference of 0.33%), and Slavic (6.6%, a difference of 0.46%).
| Demographics | Rating | Rank | 4 or more Vehicles in Household |
| Luxembourgers | 86.4 /100 | #136 | Excellent 6.6% |
| French Canadians | 85.4 /100 | #137 | Excellent 6.6% |
| Italians | 84.5 /100 | #138 | Excellent 6.6% |
| Jordanians | 82.1 /100 | #139 | Excellent 6.6% |
| Slavs | 81.6 /100 | #140 | Excellent 6.6% |
| Australians | 80.8 /100 | #141 | Excellent 6.6% |
| Immigrants | Iraq | 79.4 /100 | #142 | Good 6.5% |
| Immigrants | Canada | 78.6 /100 | #143 | Good 6.5% |
| Immigrants | North America | 78.5 /100 | #144 | Good 6.5% |
| Croatians | 77.8 /100 | #145 | Good 6.5% |
| Immigrants | Costa Rica | 74.4 /100 | #146 | Good 6.5% |
| Immigrants | Iran | 73.9 /100 | #147 | Good 6.5% |
| Immigrants | Jordan | 73.7 /100 | #148 | Good 6.5% |
| Greeks | 73.6 /100 | #149 | Good 6.5% |
| New Zealanders | 73.3 /100 | #150 | Good 6.5% |
Demographics Similar to South Africans by 4 or more Vehicles in Household
In terms of 4 or more vehicles in household, the demographic groups most similar to South Africans are Immigrants from Eastern Asia (6.2%, a difference of 0.12%), Inupiat (6.2%, a difference of 0.18%), Romanian (6.2%, a difference of 0.19%), Kiowa (6.2%, a difference of 0.29%), and Immigrants from South Africa (6.2%, a difference of 0.36%).
| Demographics | Rating | Rank | 4 or more Vehicles in Household |
| Immigrants | Burma/Myanmar | 37.5 /100 | #183 | Fair 6.2% |
| Iraqis | 37.3 /100 | #184 | Fair 6.2% |
| Thais | 36.9 /100 | #185 | Fair 6.2% |
| Immigrants | Northern Europe | 36.8 /100 | #186 | Fair 6.2% |
| Immigrants | South Africa | 35.4 /100 | #187 | Fair 6.2% |
| Kiowa | 34.7 /100 | #188 | Fair 6.2% |
| Immigrants | Eastern Asia | 33.3 /100 | #189 | Fair 6.2% |
| South Africans | 32.2 /100 | #190 | Fair 6.2% |
| Inupiat | 30.7 /100 | #191 | Fair 6.2% |
| Romanians | 30.7 /100 | #192 | Fair 6.2% |
| Immigrants | Kuwait | 28.0 /100 | #193 | Fair 6.2% |
| Immigrants | Sweden | 27.0 /100 | #194 | Fair 6.2% |
| Argentineans | 27.0 /100 | #195 | Fair 6.2% |
| Tsimshian | 26.4 /100 | #196 | Fair 6.2% |
| Immigrants | Sri Lanka | 23.7 /100 | #197 | Fair 6.1% |