Immigrants from Zaire vs South African Unemployment Among Ages 65 to 74 years
COMPARE
Immigrants from Zaire
South African
Unemployment Among Ages 65 to 74 years
Unemployment Among Ages 65 to 74 years Comparison
Immigrants from Zaire
South Africans
4.8%
UNEMPLOYMENT AMONG AGES 65 TO 74 YEARS
100.0/ 100
METRIC RATING
20th/ 347
METRIC RANK
5.2%
UNEMPLOYMENT AMONG AGES 65 TO 74 YEARS
97.1/ 100
METRIC RATING
94th/ 347
METRIC RANK
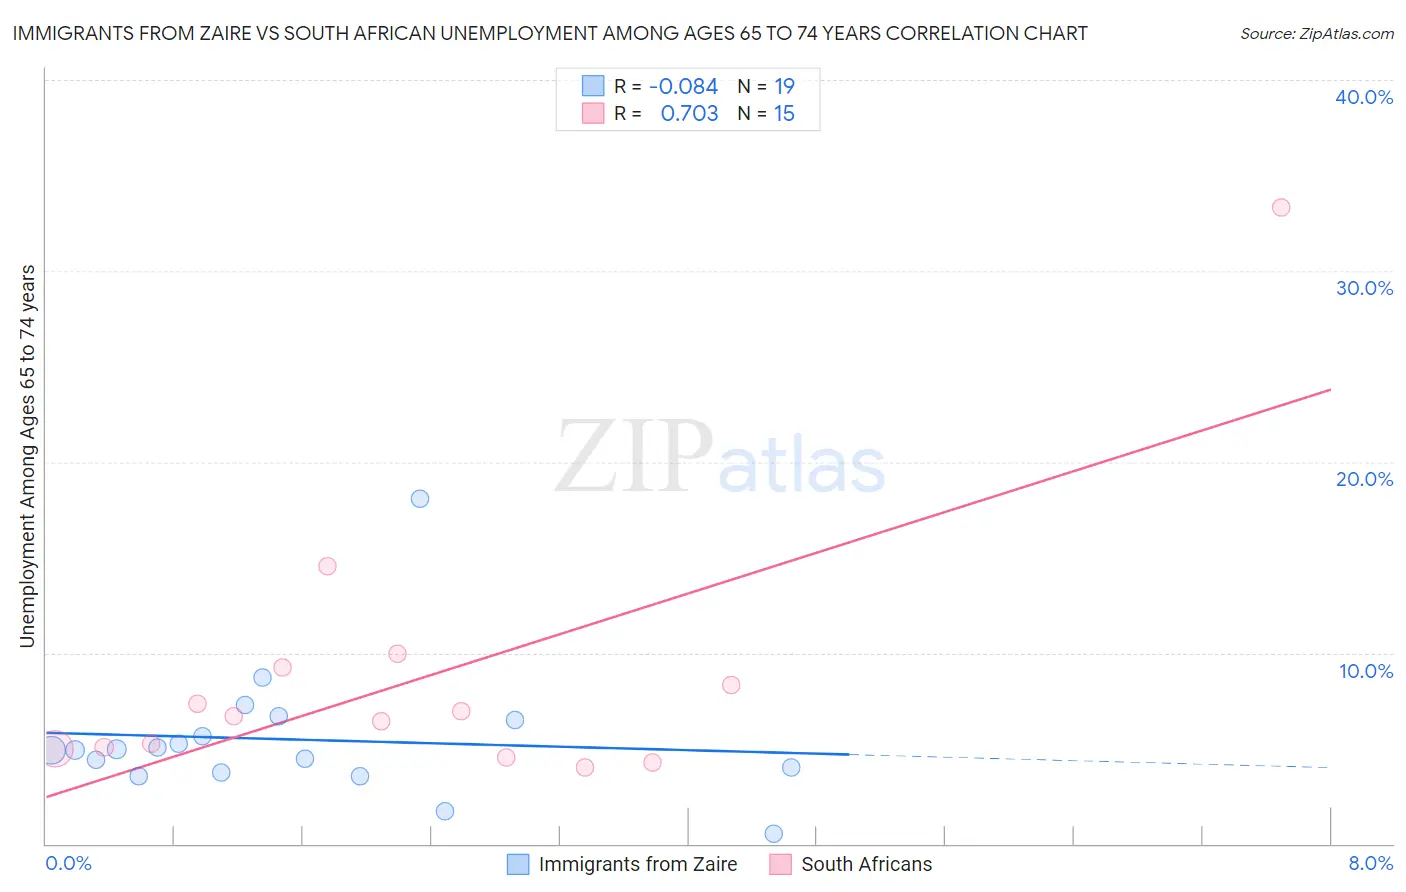
Immigrants from Zaire vs South African Unemployment Among Ages 65 to 74 years Correlation Chart
The statistical analysis conducted on geographies consisting of 102,246,015 people shows a slight negative correlation between the proportion of Immigrants from Zaire and unemployment rate among population between the ages 65 and 74 in the United States with a correlation coefficient (R) of -0.084 and weighted average of 4.8%. Similarly, the statistical analysis conducted on geographies consisting of 170,569,944 people shows a strong positive correlation between the proportion of South Africans and unemployment rate among population between the ages 65 and 74 in the United States with a correlation coefficient (R) of 0.703 and weighted average of 5.2%, a difference of 7.6%.
Unemployment Among Ages 65 to 74 years Correlation Summary
| Measurement | Immigrants from Zaire | South African |
| Minimum | 0.50% | 4.0% |
| Maximum | 18.1% | 33.3% |
| Range | 17.6% | 29.3% |
| Mean | 5.5% | 8.7% |
| Median | 4.9% | 6.7% |
| Interquartile 25% (IQ1) | 3.7% | 5.0% |
| Interquartile 75% (IQ3) | 6.5% | 9.2% |
| Interquartile Range (IQR) | 2.8% | 4.2% |
| Standard Deviation (Sample) | 3.6% | 7.3% |
| Standard Deviation (Population) | 3.5% | 7.1% |
Similar Demographics by Unemployment Among Ages 65 to 74 years
Demographics Similar to Immigrants from Zaire by Unemployment Among Ages 65 to 74 years
In terms of unemployment among ages 65 to 74 years, the demographic groups most similar to Immigrants from Zaire are Menominee (4.8%, a difference of 0.26%), Creek (4.8%, a difference of 0.30%), Kenyan (4.8%, a difference of 0.38%), Immigrants from Eritrea (4.9%, a difference of 0.38%), and Immigrants from Burma/Myanmar (4.8%, a difference of 0.40%).
| Demographics | Rating | Rank | Unemployment Among Ages 65 to 74 years |
| Lumbee | 100.0 /100 | #13 | Exceptional 4.8% |
| Cubans | 100.0 /100 | #14 | Exceptional 4.8% |
| Immigrants | North Macedonia | 100.0 /100 | #15 | Exceptional 4.8% |
| Immigrants | Burma/Myanmar | 100.0 /100 | #16 | Exceptional 4.8% |
| Kenyans | 100.0 /100 | #17 | Exceptional 4.8% |
| Creek | 100.0 /100 | #18 | Exceptional 4.8% |
| Menominee | 100.0 /100 | #19 | Exceptional 4.8% |
| Immigrants | Zaire | 100.0 /100 | #20 | Exceptional 4.8% |
| Immigrants | Eritrea | 100.0 /100 | #21 | Exceptional 4.9% |
| Lebanese | 100.0 /100 | #22 | Exceptional 4.9% |
| Immigrants | Nepal | 100.0 /100 | #23 | Exceptional 4.9% |
| Iraqis | 100.0 /100 | #24 | Exceptional 4.9% |
| Macedonians | 100.0 /100 | #25 | Exceptional 5.0% |
| Czechs | 100.0 /100 | #26 | Exceptional 5.0% |
| Norwegians | 100.0 /100 | #27 | Exceptional 5.0% |
Demographics Similar to South Africans by Unemployment Among Ages 65 to 74 years
In terms of unemployment among ages 65 to 74 years, the demographic groups most similar to South Africans are Serbian (5.2%, a difference of 0.0%), Immigrants from Netherlands (5.2%, a difference of 0.020%), Immigrants from Thailand (5.2%, a difference of 0.030%), Puget Sound Salish (5.2%, a difference of 0.080%), and Romanian (5.2%, a difference of 0.10%).
| Demographics | Rating | Rank | Unemployment Among Ages 65 to 74 years |
| Scottish | 97.9 /100 | #87 | Exceptional 5.2% |
| Immigrants | Saudi Arabia | 97.9 /100 | #88 | Exceptional 5.2% |
| English | 97.8 /100 | #89 | Exceptional 5.2% |
| Luxembourgers | 97.6 /100 | #90 | Exceptional 5.2% |
| Romanians | 97.4 /100 | #91 | Exceptional 5.2% |
| Puget Sound Salish | 97.3 /100 | #92 | Exceptional 5.2% |
| Immigrants | Netherlands | 97.1 /100 | #93 | Exceptional 5.2% |
| South Africans | 97.1 /100 | #94 | Exceptional 5.2% |
| Serbians | 97.0 /100 | #95 | Exceptional 5.2% |
| Immigrants | Thailand | 97.0 /100 | #96 | Exceptional 5.2% |
| Senegalese | 96.5 /100 | #97 | Exceptional 5.2% |
| Welsh | 96.5 /100 | #98 | Exceptional 5.2% |
| Burmese | 96.4 /100 | #99 | Exceptional 5.2% |
| Japanese | 96.4 /100 | #100 | Exceptional 5.2% |
| Immigrants | Cambodia | 96.3 /100 | #101 | Exceptional 5.2% |