Immigrants from Western Europe vs Immigrants from Iran Seniors Poverty Over the Age of 65
COMPARE
Immigrants from Western Europe
Immigrants from Iran
Seniors Poverty Over the Age of 65
Seniors Poverty Over the Age of 65 Comparison
Immigrants from Western Europe
Immigrants from Iran
10.4%
SENIORS POVERTY OVER THE AGE OF 65
91.1/ 100
METRIC RATING
119th/ 347
METRIC RANK
10.4%
SENIORS POVERTY OVER THE AGE OF 65
88.4/ 100
METRIC RATING
129th/ 347
METRIC RANK
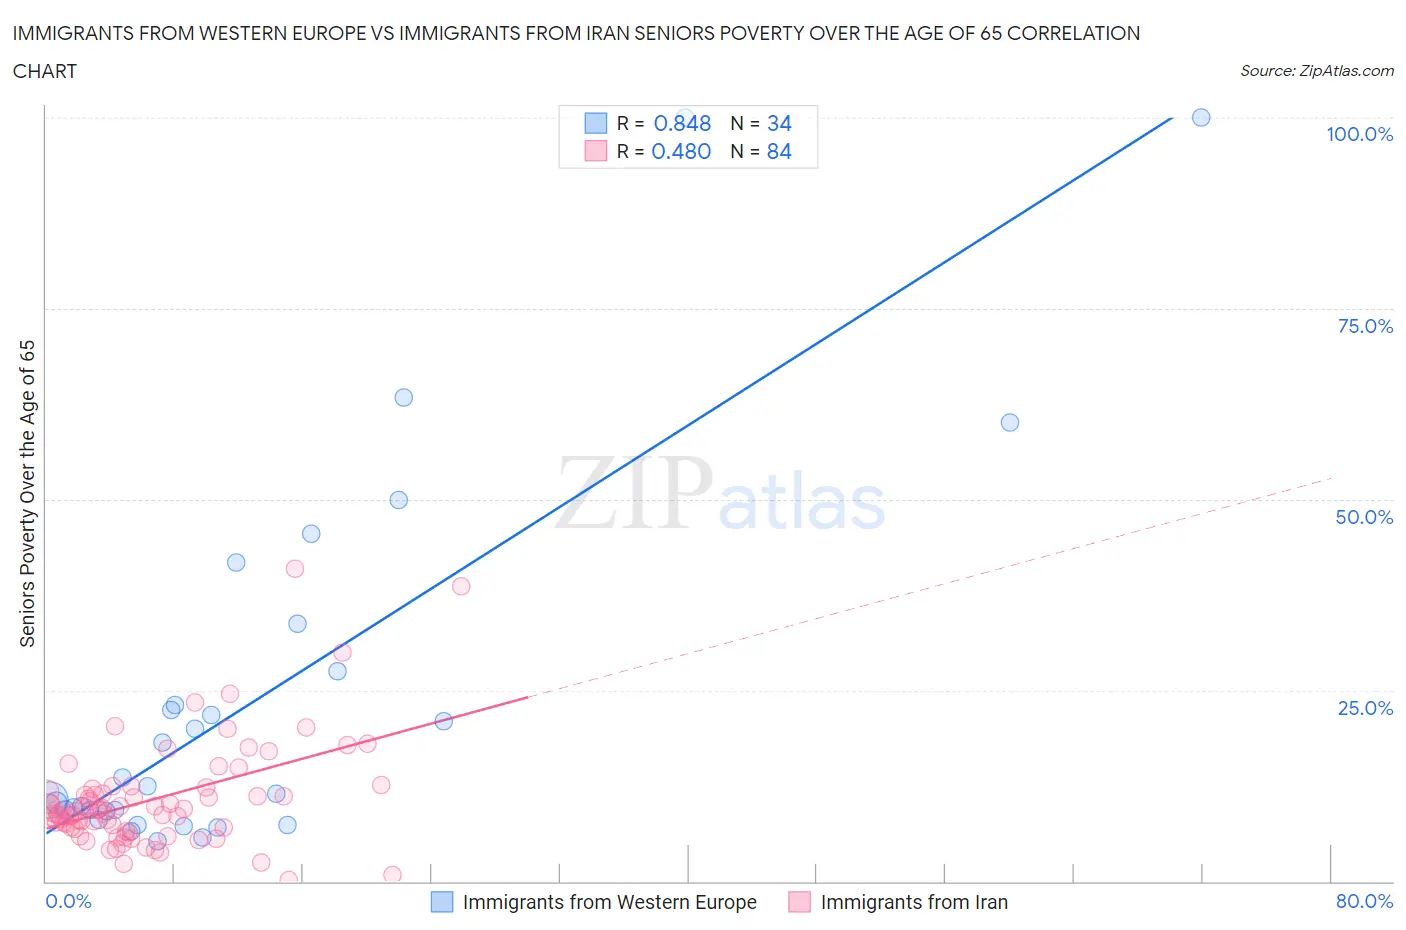
Immigrants from Western Europe vs Immigrants from Iran Seniors Poverty Over the Age of 65 Correlation Chart
The statistical analysis conducted on geographies consisting of 491,602,141 people shows a very strong positive correlation between the proportion of Immigrants from Western Europe and poverty level among seniors over the age of 65 in the United States with a correlation coefficient (R) of 0.848 and weighted average of 10.4%. Similarly, the statistical analysis conducted on geographies consisting of 279,473,756 people shows a moderate positive correlation between the proportion of Immigrants from Iran and poverty level among seniors over the age of 65 in the United States with a correlation coefficient (R) of 0.480 and weighted average of 10.4%, a difference of 0.67%.
Seniors Poverty Over the Age of 65 Correlation Summary
| Measurement | Immigrants from Western Europe | Immigrants from Iran |
| Minimum | 5.2% | 0.21% |
| Maximum | 100.0% | 40.9% |
| Range | 94.8% | 40.7% |
| Mean | 24.1% | 10.7% |
| Median | 12.0% | 9.2% |
| Interquartile 25% (IQ1) | 9.2% | 6.9% |
| Interquartile 75% (IQ3) | 27.6% | 11.8% |
| Interquartile Range (IQR) | 18.3% | 4.9% |
| Standard Deviation (Sample) | 24.9% | 6.9% |
| Standard Deviation (Population) | 24.5% | 6.9% |
Demographics Similar to Immigrants from Western Europe and Immigrants from Iran by Seniors Poverty Over the Age of 65
In terms of seniors poverty over the age of 65, the demographic groups most similar to Immigrants from Western Europe are Immigrants from Bosnia and Herzegovina (10.4%, a difference of 0.060%), Immigrants from Iraq (10.4%, a difference of 0.10%), Immigrants from Moldova (10.4%, a difference of 0.11%), Okinawan (10.4%, a difference of 0.19%), and Lebanese (10.3%, a difference of 0.27%). Similarly, the demographic groups most similar to Immigrants from Iran are Immigrants from Oceania (10.4%, a difference of 0.0%), Ottawa (10.4%, a difference of 0.020%), Immigrants from Hungary (10.4%, a difference of 0.15%), Cambodian (10.4%, a difference of 0.15%), and Egyptian (10.5%, a difference of 0.15%).
| Demographics | Rating | Rank | Seniors Poverty Over the Age of 65 |
| Immigrants | Denmark | 92.7 /100 | #114 | Exceptional 10.3% |
| Immigrants | Italy | 92.6 /100 | #115 | Exceptional 10.3% |
| Pakistanis | 92.2 /100 | #116 | Exceptional 10.3% |
| Lebanese | 92.0 /100 | #117 | Exceptional 10.3% |
| Okinawans | 91.7 /100 | #118 | Exceptional 10.4% |
| Immigrants | Western Europe | 91.1 /100 | #119 | Exceptional 10.4% |
| Immigrants | Bosnia and Herzegovina | 90.8 /100 | #120 | Exceptional 10.4% |
| Immigrants | Iraq | 90.7 /100 | #121 | Exceptional 10.4% |
| Immigrants | Moldova | 90.7 /100 | #122 | Exceptional 10.4% |
| Hmong | 90.0 /100 | #123 | Exceptional 10.4% |
| Asians | 89.9 /100 | #124 | Excellent 10.4% |
| Immigrants | Philippines | 89.4 /100 | #125 | Excellent 10.4% |
| Immigrants | Hungary | 89.1 /100 | #126 | Excellent 10.4% |
| Cambodians | 89.1 /100 | #127 | Excellent 10.4% |
| Ottawa | 88.5 /100 | #128 | Excellent 10.4% |
| Immigrants | Iran | 88.4 /100 | #129 | Excellent 10.4% |
| Immigrants | Oceania | 88.4 /100 | #130 | Excellent 10.4% |
| Egyptians | 87.8 /100 | #131 | Excellent 10.5% |
| Immigrants | Turkey | 87.7 /100 | #132 | Excellent 10.5% |
| Guamanians/Chamorros | 87.5 /100 | #133 | Excellent 10.5% |
| Sierra Leoneans | 86.8 /100 | #134 | Excellent 10.5% |