Immigrants from Turkey vs Marshallese 3 or more Vehicles in Household
COMPARE
Immigrants from Turkey
Marshallese
3 or more Vehicles in Household
3 or more Vehicles in Household Comparison
Immigrants from Turkey
Marshallese
17.9%
3 OR MORE VEHICLES IN HOUSEHOLD
1.2/ 100
METRIC RATING
255th/ 347
METRIC RANK
21.3%
3 OR MORE VEHICLES IN HOUSEHOLD
99.2/ 100
METRIC RATING
89th/ 347
METRIC RANK
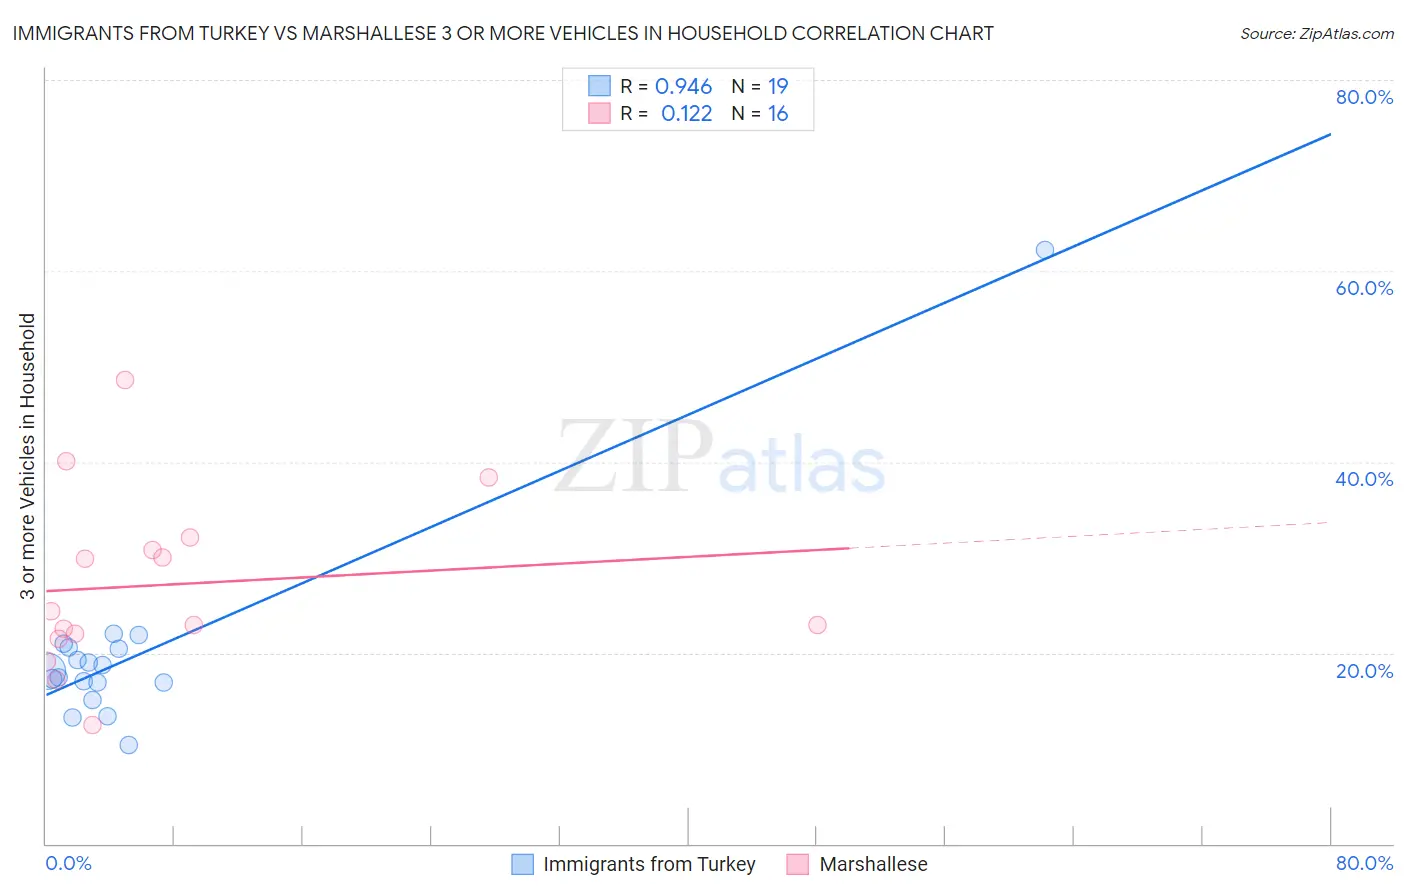
Immigrants from Turkey vs Marshallese 3 or more Vehicles in Household Correlation Chart
The statistical analysis conducted on geographies consisting of 222,920,746 people shows a near-perfect positive correlation between the proportion of Immigrants from Turkey and percentage of households with 3 or more vehicles available in the United States with a correlation coefficient (R) of 0.946 and weighted average of 17.9%. Similarly, the statistical analysis conducted on geographies consisting of 14,761,315 people shows a poor positive correlation between the proportion of Marshallese and percentage of households with 3 or more vehicles available in the United States with a correlation coefficient (R) of 0.122 and weighted average of 21.3%, a difference of 19.0%.
3 or more Vehicles in Household Correlation Summary
| Measurement | Immigrants from Turkey | Marshallese |
| Minimum | 10.4% | 12.4% |
| Maximum | 62.2% | 48.6% |
| Range | 51.8% | 36.2% |
| Mean | 20.0% | 27.2% |
| Median | 18.0% | 23.7% |
| Interquartile 25% (IQ1) | 16.8% | 21.8% |
| Interquartile 75% (IQ3) | 20.6% | 31.4% |
| Interquartile Range (IQR) | 3.7% | 9.6% |
| Standard Deviation (Sample) | 10.7% | 9.3% |
| Standard Deviation (Population) | 10.4% | 9.0% |
Similar Demographics by 3 or more Vehicles in Household
Demographics Similar to Immigrants from Turkey by 3 or more Vehicles in Household
In terms of 3 or more vehicles in household, the demographic groups most similar to Immigrants from Turkey are Immigrants from Ethiopia (17.9%, a difference of 0.030%), Ethiopian (17.9%, a difference of 0.030%), Subsaharan African (17.9%, a difference of 0.15%), Immigrants from Eritrea (17.8%, a difference of 0.20%), and Sudanese (17.8%, a difference of 0.20%).
| Demographics | Rating | Rank | 3 or more Vehicles in Household |
| Immigrants | Eastern Africa | 1.8 /100 | #248 | Tragic 18.0% |
| Immigrants | Saudi Arabia | 1.7 /100 | #249 | Tragic 18.0% |
| Venezuelans | 1.7 /100 | #250 | Tragic 18.0% |
| Alsatians | 1.5 /100 | #251 | Tragic 18.0% |
| Immigrants | Southern Europe | 1.4 /100 | #252 | Tragic 17.9% |
| Immigrants | Ethiopia | 1.3 /100 | #253 | Tragic 17.9% |
| Ethiopians | 1.2 /100 | #254 | Tragic 17.9% |
| Immigrants | Turkey | 1.2 /100 | #255 | Tragic 17.9% |
| Sub-Saharan Africans | 1.1 /100 | #256 | Tragic 17.9% |
| Immigrants | Eritrea | 1.1 /100 | #257 | Tragic 17.8% |
| Sudanese | 1.1 /100 | #258 | Tragic 17.8% |
| Uruguayans | 1.0 /100 | #259 | Tragic 17.8% |
| Ugandans | 0.9 /100 | #260 | Tragic 17.8% |
| Immigrants | Northern Africa | 0.9 /100 | #261 | Tragic 17.8% |
| Colombians | 0.9 /100 | #262 | Tragic 17.8% |
Demographics Similar to Marshallese by 3 or more Vehicles in Household
In terms of 3 or more vehicles in household, the demographic groups most similar to Marshallese are Immigrants from Afghanistan (21.2%, a difference of 0.22%), Belgian (21.2%, a difference of 0.55%), French (21.4%, a difference of 0.56%), Apache (21.2%, a difference of 0.63%), and Immigrants from the Azores (21.5%, a difference of 0.82%).
| Demographics | Rating | Rank | 3 or more Vehicles in Household |
| Immigrants | El Salvador | 99.6 /100 | #82 | Exceptional 21.5% |
| Chippewa | 99.6 /100 | #83 | Exceptional 21.5% |
| Icelanders | 99.6 /100 | #84 | Exceptional 21.5% |
| Laotians | 99.6 /100 | #85 | Exceptional 21.5% |
| Delaware | 99.6 /100 | #86 | Exceptional 21.5% |
| Immigrants | Azores | 99.5 /100 | #87 | Exceptional 21.5% |
| French | 99.4 /100 | #88 | Exceptional 21.4% |
| Marshallese | 99.2 /100 | #89 | Exceptional 21.3% |
| Immigrants | Afghanistan | 99.1 /100 | #90 | Exceptional 21.2% |
| Belgians | 98.9 /100 | #91 | Exceptional 21.2% |
| Apache | 98.9 /100 | #92 | Exceptional 21.2% |
| Immigrants | Indonesia | 98.8 /100 | #93 | Exceptional 21.1% |
| Immigrants | Cambodia | 98.6 /100 | #94 | Exceptional 21.1% |
| Pakistanis | 98.5 /100 | #95 | Exceptional 21.0% |
| Cree | 98.4 /100 | #96 | Exceptional 21.0% |