Immigrants from Thailand vs Jamaican Male Unemployment
COMPARE
Immigrants from Thailand
Jamaican
Male Unemployment
Male Unemployment Comparison
Immigrants from Thailand
Jamaicans
5.4%
MALE UNEMPLOYMENT
14.7/ 100
METRIC RATING
198th/ 347
METRIC RANK
6.6%
MALE UNEMPLOYMENT
0.0/ 100
METRIC RATING
298th/ 347
METRIC RANK
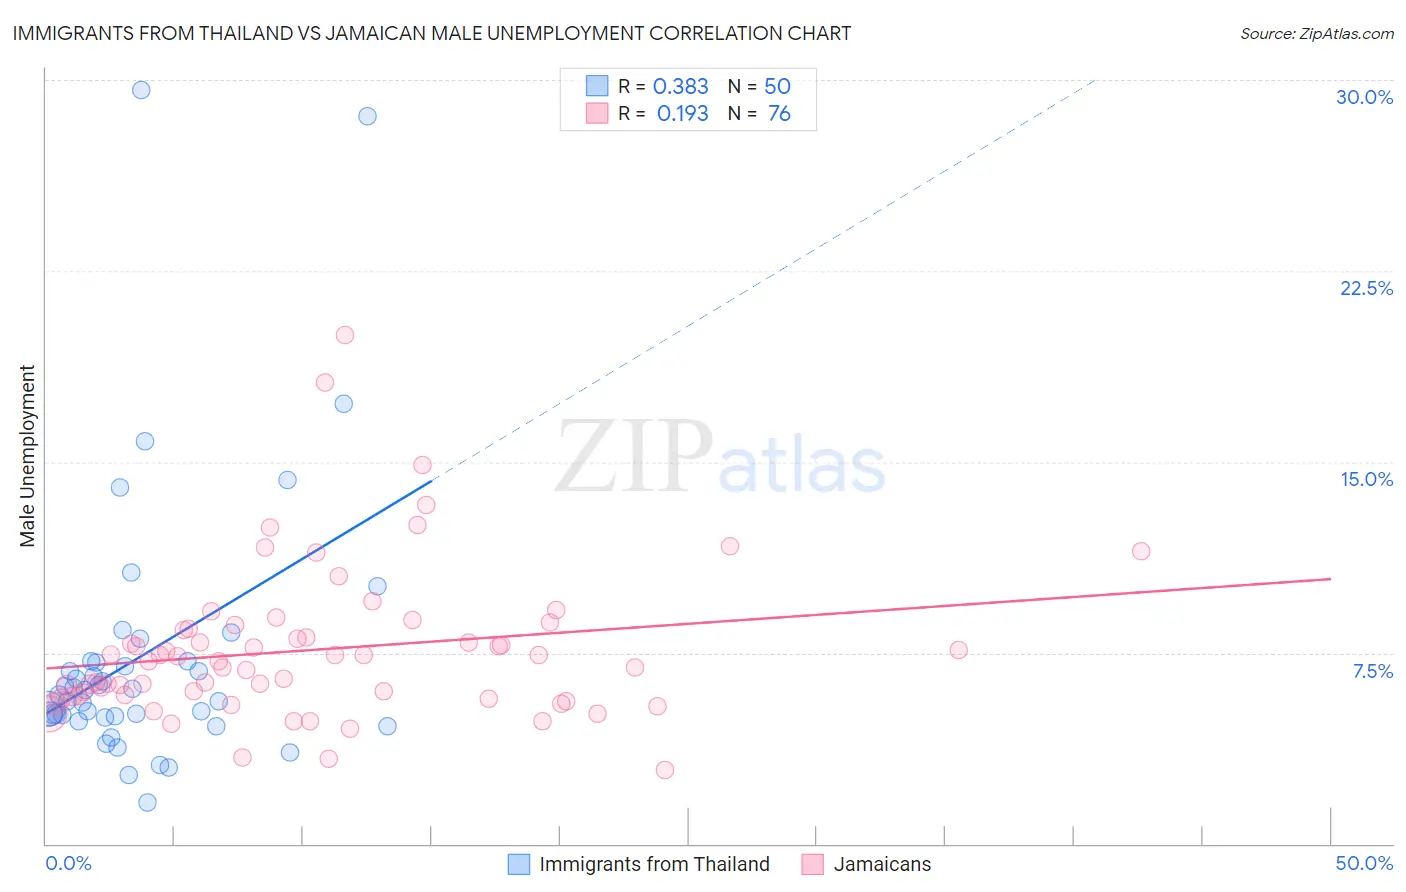
Immigrants from Thailand vs Jamaican Male Unemployment Correlation Chart
The statistical analysis conducted on geographies consisting of 316,225,020 people shows a mild positive correlation between the proportion of Immigrants from Thailand and unemployment rate among males in the United States with a correlation coefficient (R) of 0.383 and weighted average of 5.4%. Similarly, the statistical analysis conducted on geographies consisting of 366,759,290 people shows a poor positive correlation between the proportion of Jamaicans and unemployment rate among males in the United States with a correlation coefficient (R) of 0.193 and weighted average of 6.6%, a difference of 20.7%.
Male Unemployment Correlation Summary
| Measurement | Immigrants from Thailand | Jamaican |
| Minimum | 1.6% | 2.9% |
| Maximum | 29.6% | 20.0% |
| Range | 28.0% | 17.1% |
| Mean | 7.4% | 7.6% |
| Median | 5.9% | 7.2% |
| Interquartile 25% (IQ1) | 5.0% | 5.8% |
| Interquartile 75% (IQ3) | 7.2% | 8.4% |
| Interquartile Range (IQR) | 2.2% | 2.6% |
| Standard Deviation (Sample) | 5.5% | 3.0% |
| Standard Deviation (Population) | 5.4% | 3.0% |
Similar Demographics by Male Unemployment
Demographics Similar to Immigrants from Thailand by Male Unemployment
In terms of male unemployment, the demographic groups most similar to Immigrants from Thailand are Immigrants from Greece (5.4%, a difference of 0.020%), Immigrants from Zaire (5.4%, a difference of 0.12%), Immigrants from Philippines (5.4%, a difference of 0.15%), Nonimmigrants (5.4%, a difference of 0.19%), and Immigrants from Laos (5.4%, a difference of 0.20%).
| Demographics | Rating | Rank | Male Unemployment |
| Immigrants | South Eastern Asia | 28.2 /100 | #191 | Fair 5.4% |
| Immigrants | Belarus | 26.0 /100 | #192 | Fair 5.4% |
| Immigrants | Israel | 25.2 /100 | #193 | Fair 5.4% |
| Spanish | 19.7 /100 | #194 | Poor 5.4% |
| Immigrants | Southern Europe | 17.7 /100 | #195 | Poor 5.4% |
| Albanians | 17.3 /100 | #196 | Poor 5.4% |
| Alsatians | 16.7 /100 | #197 | Poor 5.4% |
| Immigrants | Thailand | 14.7 /100 | #198 | Poor 5.4% |
| Immigrants | Greece | 14.5 /100 | #199 | Poor 5.4% |
| Immigrants | Zaire | 13.7 /100 | #200 | Poor 5.4% |
| Immigrants | Philippines | 13.5 /100 | #201 | Poor 5.4% |
| Immigrants | Nonimmigrants | 13.1 /100 | #202 | Poor 5.4% |
| Immigrants | Laos | 13.0 /100 | #203 | Poor 5.4% |
| Guamanians/Chamorros | 12.3 /100 | #204 | Poor 5.4% |
| Immigrants | Costa Rica | 11.4 /100 | #205 | Poor 5.5% |
Demographics Similar to Jamaicans by Male Unemployment
In terms of male unemployment, the demographic groups most similar to Jamaicans are Chippewa (6.6%, a difference of 0.080%), Immigrants from Bangladesh (6.6%, a difference of 0.13%), Immigrants from Haiti (6.5%, a difference of 0.40%), Vietnamese (6.6%, a difference of 0.40%), and Immigrants from Belize (6.6%, a difference of 0.51%).
| Demographics | Rating | Rank | Male Unemployment |
| Immigrants | Azores | 0.0 /100 | #291 | Tragic 6.4% |
| Nepalese | 0.0 /100 | #292 | Tragic 6.4% |
| Haitians | 0.0 /100 | #293 | Tragic 6.4% |
| Senegalese | 0.0 /100 | #294 | Tragic 6.4% |
| Belizeans | 0.0 /100 | #295 | Tragic 6.5% |
| Immigrants | Haiti | 0.0 /100 | #296 | Tragic 6.5% |
| Chippewa | 0.0 /100 | #297 | Tragic 6.6% |
| Jamaicans | 0.0 /100 | #298 | Tragic 6.6% |
| Immigrants | Bangladesh | 0.0 /100 | #299 | Tragic 6.6% |
| Vietnamese | 0.0 /100 | #300 | Tragic 6.6% |
| Immigrants | Belize | 0.0 /100 | #301 | Tragic 6.6% |
| Ute | 0.0 /100 | #302 | Tragic 6.6% |
| Immigrants | West Indies | 0.0 /100 | #303 | Tragic 6.7% |
| West Indians | 0.0 /100 | #304 | Tragic 6.7% |
| Trinidadians and Tobagonians | 0.0 /100 | #305 | Tragic 6.7% |