Immigrants from Switzerland vs Eastern European Median Female Earnings
COMPARE
Immigrants from Switzerland
Eastern European
Median Female Earnings
Median Female Earnings Comparison
Immigrants from Switzerland
Eastern Europeans
$43,996
MEDIAN FEMALE EARNINGS
100.0/ 100
METRIC RATING
37th/ 347
METRIC RANK
$45,385
MEDIAN FEMALE EARNINGS
100.0/ 100
METRIC RATING
19th/ 347
METRIC RANK
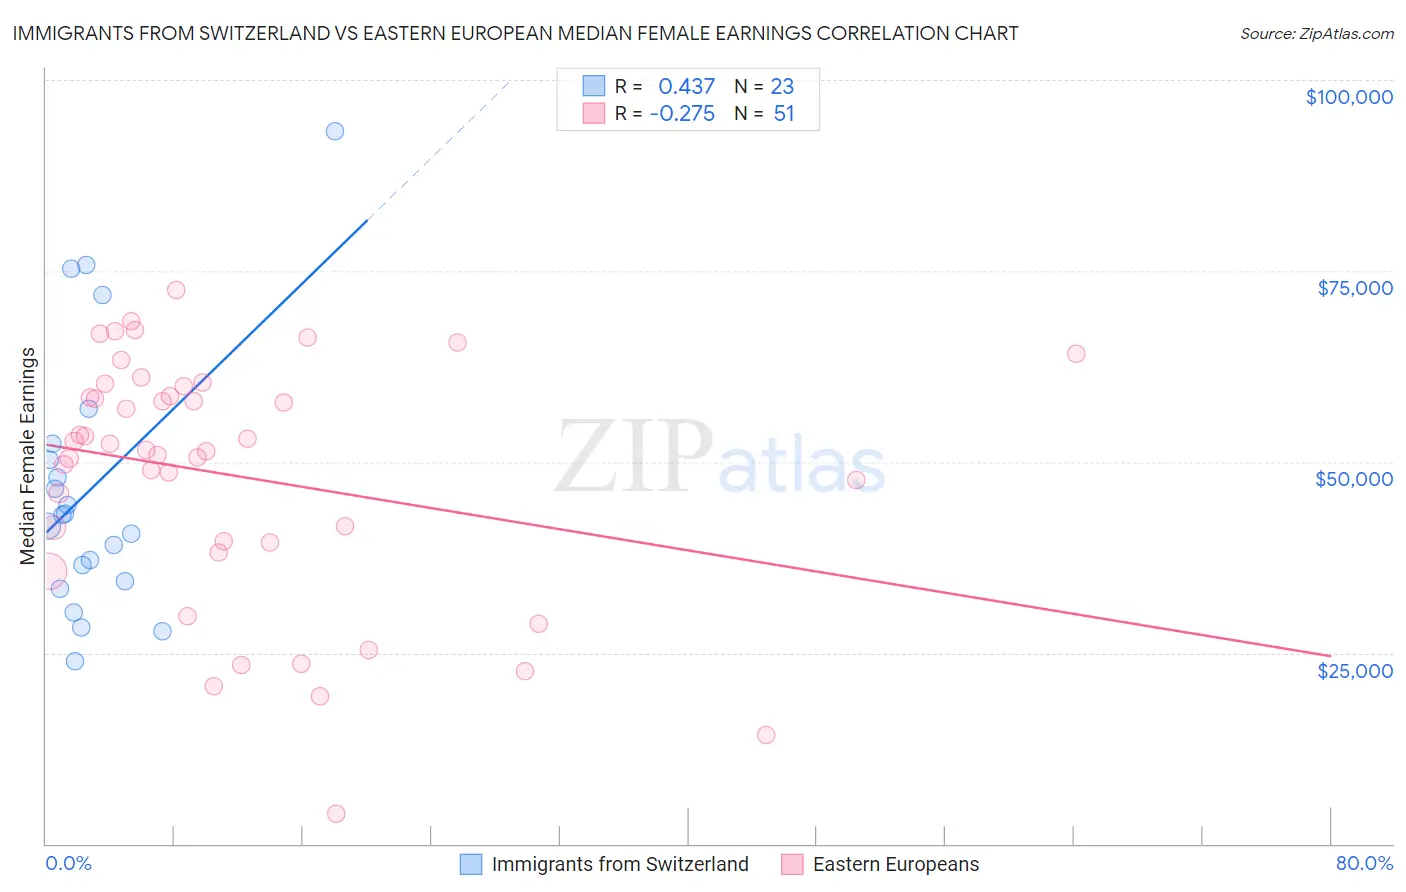
Immigrants from Switzerland vs Eastern European Median Female Earnings Correlation Chart
The statistical analysis conducted on geographies consisting of 148,042,393 people shows a moderate positive correlation between the proportion of Immigrants from Switzerland and median female earnings in the United States with a correlation coefficient (R) of 0.437 and weighted average of $43,996. Similarly, the statistical analysis conducted on geographies consisting of 460,854,647 people shows a weak negative correlation between the proportion of Eastern Europeans and median female earnings in the United States with a correlation coefficient (R) of -0.275 and weighted average of $45,385, a difference of 3.2%.
Median Female Earnings Correlation Summary
| Measurement | Immigrants from Switzerland | Eastern European |
| Minimum | $23,823 | $3,984 |
| Maximum | $93,289 | $72,541 |
| Range | $69,466 | $68,557 |
| Mean | $46,683 | $48,179 |
| Median | $43,003 | $51,543 |
| Interquartile 25% (IQ1) | $34,297 | $39,388 |
| Interquartile 75% (IQ3) | $52,304 | $59,979 |
| Interquartile Range (IQR) | $18,007 | $20,591 |
| Standard Deviation (Sample) | $17,546 | $16,076 |
| Standard Deviation (Population) | $17,160 | $15,918 |
Demographics Similar to Immigrants from Switzerland and Eastern Europeans by Median Female Earnings
In terms of median female earnings, the demographic groups most similar to Immigrants from Switzerland are Latvian ($43,941, a difference of 0.12%), Immigrants from Turkey ($44,066, a difference of 0.16%), Immigrants from Sri Lanka ($44,161, a difference of 0.37%), Russian ($44,169, a difference of 0.39%), and Immigrants from Asia ($44,198, a difference of 0.46%). Similarly, the demographic groups most similar to Eastern Europeans are Immigrants from Japan ($45,323, a difference of 0.14%), Cypriot ($45,570, a difference of 0.41%), Cambodian ($45,014, a difference of 0.82%), Immigrants from Greece ($44,976, a difference of 0.91%), and Burmese ($44,911, a difference of 1.1%).
| Demographics | Rating | Rank | Median Female Earnings |
| Cypriots | 100.0 /100 | #18 | Exceptional $45,570 |
| Eastern Europeans | 100.0 /100 | #19 | Exceptional $45,385 |
| Immigrants | Japan | 100.0 /100 | #20 | Exceptional $45,323 |
| Cambodians | 100.0 /100 | #21 | Exceptional $45,014 |
| Immigrants | Greece | 100.0 /100 | #22 | Exceptional $44,976 |
| Burmese | 100.0 /100 | #23 | Exceptional $44,911 |
| Immigrants | Korea | 100.0 /100 | #24 | Exceptional $44,847 |
| Immigrants | Sweden | 100.0 /100 | #25 | Exceptional $44,774 |
| Immigrants | Belarus | 100.0 /100 | #26 | Exceptional $44,757 |
| Turks | 100.0 /100 | #27 | Exceptional $44,695 |
| Immigrants | Russia | 100.0 /100 | #28 | Exceptional $44,680 |
| Immigrants | Belgium | 100.0 /100 | #29 | Exceptional $44,587 |
| Asians | 100.0 /100 | #30 | Exceptional $44,586 |
| Immigrants | France | 100.0 /100 | #31 | Exceptional $44,541 |
| Immigrants | Northern Europe | 100.0 /100 | #32 | Exceptional $44,366 |
| Immigrants | Asia | 100.0 /100 | #33 | Exceptional $44,198 |
| Russians | 100.0 /100 | #34 | Exceptional $44,169 |
| Immigrants | Sri Lanka | 100.0 /100 | #35 | Exceptional $44,161 |
| Immigrants | Turkey | 100.0 /100 | #36 | Exceptional $44,066 |
| Immigrants | Switzerland | 100.0 /100 | #37 | Exceptional $43,996 |
| Latvians | 100.0 /100 | #38 | Exceptional $43,941 |