Immigrants from Switzerland vs Eastern European Poverty
COMPARE
Immigrants from Switzerland
Eastern European
Poverty
Poverty Comparison
Immigrants from Switzerland
Eastern Europeans
11.8%
POVERTY
83.0/ 100
METRIC RATING
137th/ 347
METRIC RANK
10.6%
POVERTY
99.7/ 100
METRIC RATING
22nd/ 347
METRIC RANK
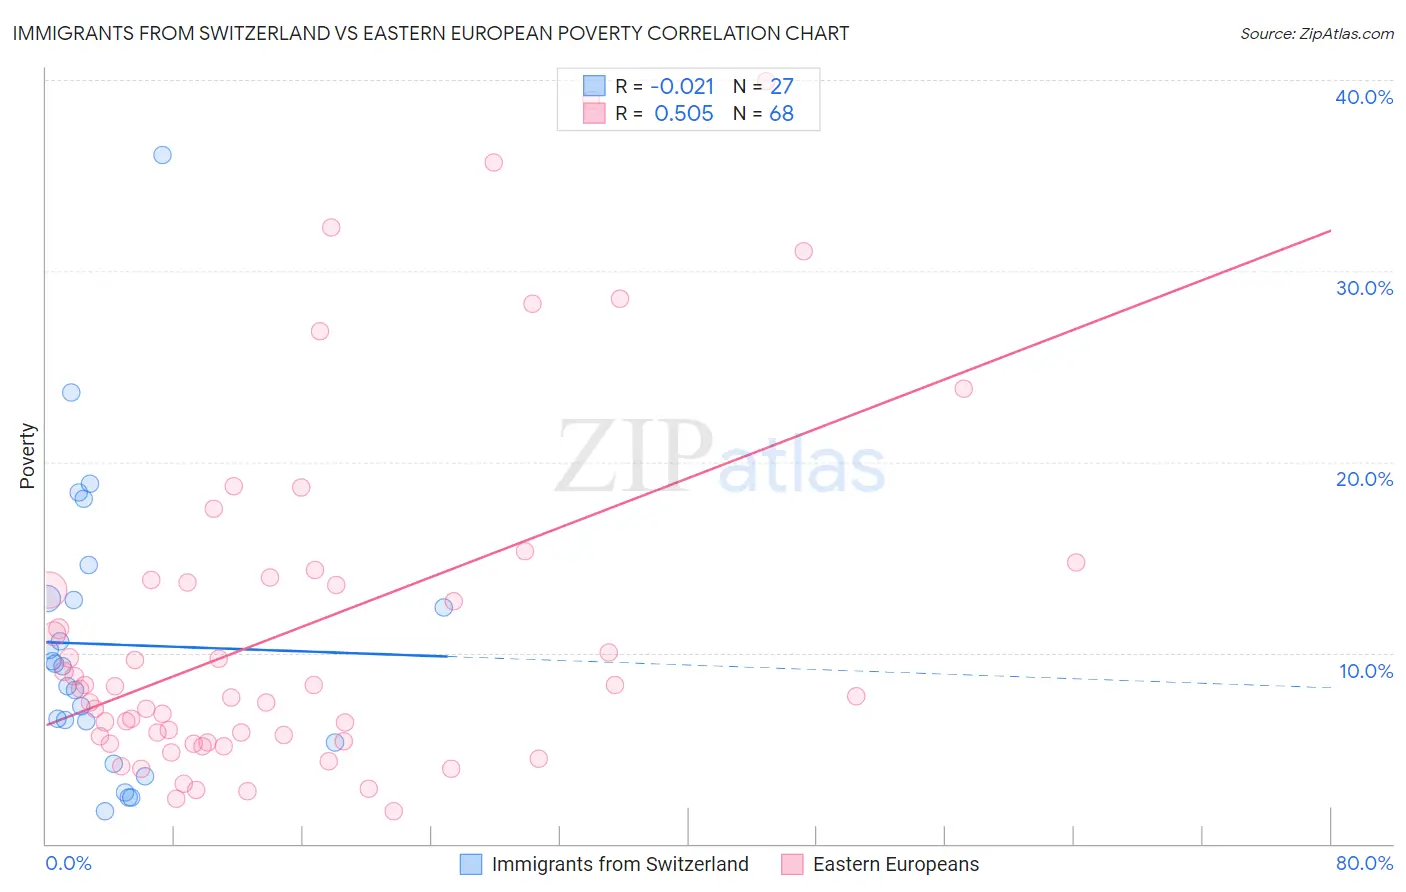
Immigrants from Switzerland vs Eastern European Poverty Correlation Chart
The statistical analysis conducted on geographies consisting of 148,064,410 people shows no correlation between the proportion of Immigrants from Switzerland and poverty level in the United States with a correlation coefficient (R) of -0.021 and weighted average of 11.8%. Similarly, the statistical analysis conducted on geographies consisting of 460,932,283 people shows a substantial positive correlation between the proportion of Eastern Europeans and poverty level in the United States with a correlation coefficient (R) of 0.505 and weighted average of 10.6%, a difference of 11.8%.
Poverty Correlation Summary
| Measurement | Immigrants from Switzerland | Eastern European |
| Minimum | 1.7% | 1.7% |
| Maximum | 36.1% | 39.9% |
| Range | 34.3% | 38.2% |
| Mean | 10.4% | 11.2% |
| Median | 9.3% | 7.9% |
| Interquartile 25% (IQ1) | 5.3% | 5.3% |
| Interquartile 75% (IQ3) | 12.8% | 13.8% |
| Interquartile Range (IQR) | 7.6% | 8.4% |
| Standard Deviation (Sample) | 7.6% | 9.1% |
| Standard Deviation (Population) | 7.5% | 9.1% |
Similar Demographics by Poverty
Demographics Similar to Immigrants from Switzerland by Poverty
In terms of poverty, the demographic groups most similar to Immigrants from Switzerland are Immigrants from Jordan (11.9%, a difference of 0.11%), Pakistani (11.9%, a difference of 0.14%), Chilean (11.8%, a difference of 0.21%), Immigrants from Peru (11.9%, a difference of 0.33%), and Immigrants from Vietnam (11.8%, a difference of 0.41%).
| Demographics | Rating | Rank | Poverty |
| Immigrants | Ukraine | 86.6 /100 | #130 | Excellent 11.8% |
| French | 86.1 /100 | #131 | Excellent 11.8% |
| Peruvians | 85.6 /100 | #132 | Excellent 11.8% |
| Immigrants | Western Europe | 85.2 /100 | #133 | Excellent 11.8% |
| Yugoslavians | 85.2 /100 | #134 | Excellent 11.8% |
| Immigrants | Vietnam | 85.2 /100 | #135 | Excellent 11.8% |
| Chileans | 84.2 /100 | #136 | Excellent 11.8% |
| Immigrants | Switzerland | 83.0 /100 | #137 | Excellent 11.8% |
| Immigrants | Jordan | 82.4 /100 | #138 | Excellent 11.9% |
| Pakistanis | 82.2 /100 | #139 | Excellent 11.9% |
| Immigrants | Peru | 81.1 /100 | #140 | Excellent 11.9% |
| Immigrants | France | 80.5 /100 | #141 | Excellent 11.9% |
| Basques | 80.4 /100 | #142 | Excellent 11.9% |
| Brazilians | 79.7 /100 | #143 | Good 11.9% |
| Icelanders | 77.9 /100 | #144 | Good 11.9% |
Demographics Similar to Eastern Europeans by Poverty
In terms of poverty, the demographic groups most similar to Eastern Europeans are Swedish (10.6%, a difference of 0.11%), Italian (10.6%, a difference of 0.15%), Luxembourger (10.6%, a difference of 0.16%), Immigrants from North Macedonia (10.6%, a difference of 0.24%), and Immigrants from Scotland (10.6%, a difference of 0.35%).
| Demographics | Rating | Rank | Poverty |
| Bolivians | 99.8 /100 | #15 | Exceptional 10.4% |
| Lithuanians | 99.8 /100 | #16 | Exceptional 10.5% |
| Norwegians | 99.8 /100 | #17 | Exceptional 10.5% |
| Latvians | 99.8 /100 | #18 | Exceptional 10.5% |
| Immigrants | Scotland | 99.7 /100 | #19 | Exceptional 10.6% |
| Immigrants | North Macedonia | 99.7 /100 | #20 | Exceptional 10.6% |
| Luxembourgers | 99.7 /100 | #21 | Exceptional 10.6% |
| Eastern Europeans | 99.7 /100 | #22 | Exceptional 10.6% |
| Swedes | 99.7 /100 | #23 | Exceptional 10.6% |
| Italians | 99.7 /100 | #24 | Exceptional 10.6% |
| Croatians | 99.6 /100 | #25 | Exceptional 10.6% |
| Burmese | 99.6 /100 | #26 | Exceptional 10.7% |
| Immigrants | Northern Europe | 99.6 /100 | #27 | Exceptional 10.7% |
| Immigrants | Korea | 99.5 /100 | #28 | Exceptional 10.7% |
| Greeks | 99.5 /100 | #29 | Exceptional 10.7% |