Immigrants from Somalia vs Macedonian Male Unemployment
COMPARE
Immigrants from Somalia
Macedonian
Male Unemployment
Male Unemployment Comparison
Immigrants from Somalia
Macedonians
5.6%
MALE UNEMPLOYMENT
1.5/ 100
METRIC RATING
234th/ 347
METRIC RANK
5.2%
MALE UNEMPLOYMENT
77.7/ 100
METRIC RATING
145th/ 347
METRIC RANK
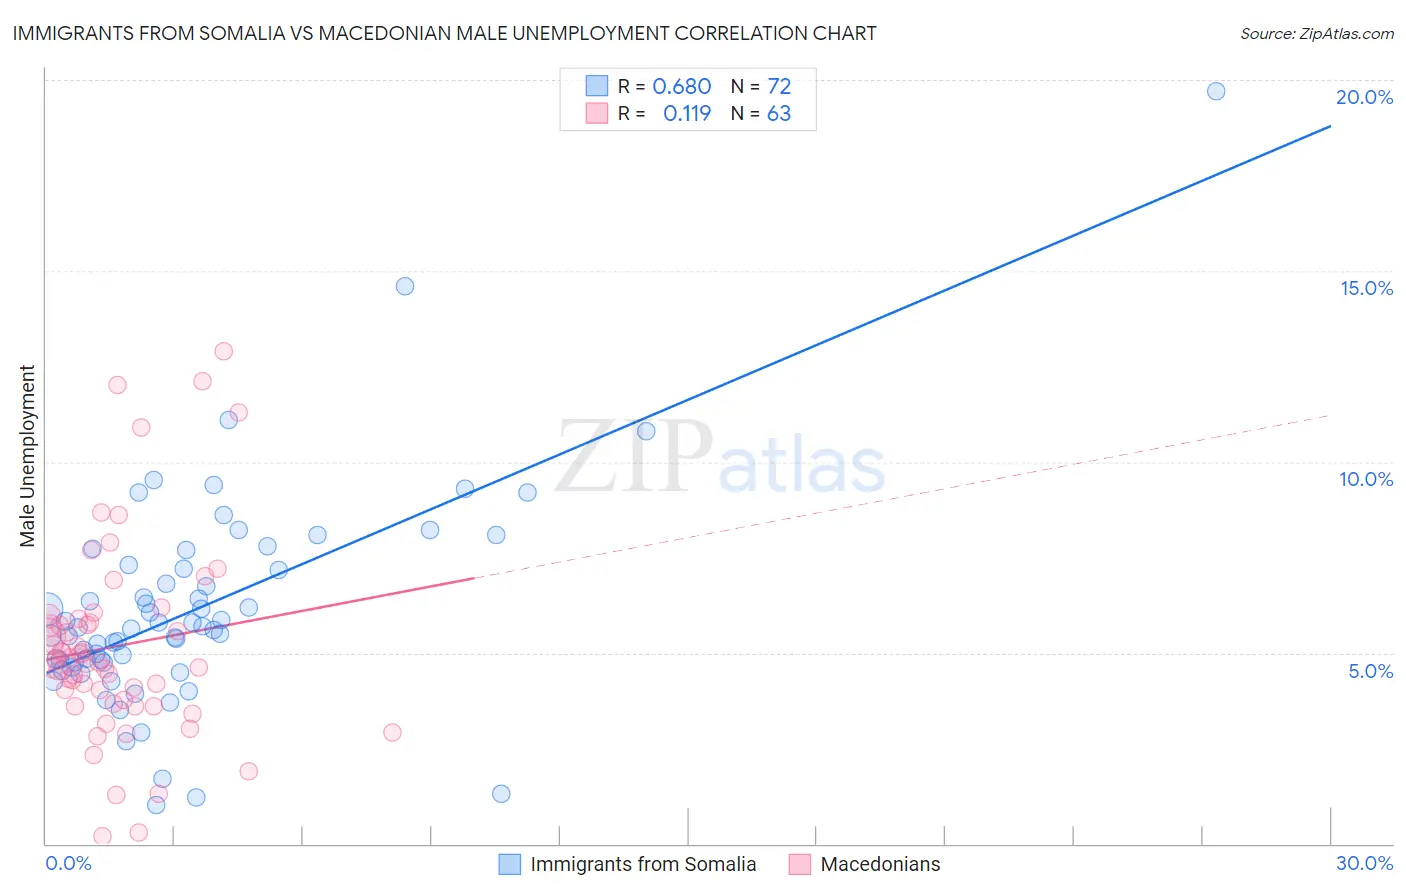
Immigrants from Somalia vs Macedonian Male Unemployment Correlation Chart
The statistical analysis conducted on geographies consisting of 92,060,853 people shows a significant positive correlation between the proportion of Immigrants from Somalia and unemployment rate among males in the United States with a correlation coefficient (R) of 0.680 and weighted average of 5.6%. Similarly, the statistical analysis conducted on geographies consisting of 132,415,215 people shows a poor positive correlation between the proportion of Macedonians and unemployment rate among males in the United States with a correlation coefficient (R) of 0.119 and weighted average of 5.2%, a difference of 8.1%.
Male Unemployment Correlation Summary
| Measurement | Immigrants from Somalia | Macedonian |
| Minimum | 1.0% | 0.20% |
| Maximum | 19.7% | 12.9% |
| Range | 18.7% | 12.7% |
| Mean | 6.1% | 5.2% |
| Median | 5.6% | 4.7% |
| Interquartile 25% (IQ1) | 4.7% | 3.7% |
| Interquartile 75% (IQ3) | 7.2% | 5.9% |
| Interquartile Range (IQR) | 2.5% | 2.2% |
| Standard Deviation (Sample) | 2.8% | 2.6% |
| Standard Deviation (Population) | 2.8% | 2.6% |
Similar Demographics by Male Unemployment
Demographics Similar to Immigrants from Somalia by Male Unemployment
In terms of male unemployment, the demographic groups most similar to Immigrants from Somalia are Somali (5.6%, a difference of 0.0%), Immigrants from Honduras (5.6%, a difference of 0.030%), Moroccan (5.6%, a difference of 0.080%), Choctaw (5.6%, a difference of 0.11%), and Immigrants from Africa (5.6%, a difference of 0.17%).
| Demographics | Rating | Rank | Male Unemployment |
| Immigrants | Panama | 1.8 /100 | #227 | Tragic 5.6% |
| Seminole | 1.8 /100 | #228 | Tragic 5.6% |
| Central Americans | 1.8 /100 | #229 | Tragic 5.6% |
| Immigrants | Africa | 1.7 /100 | #230 | Tragic 5.6% |
| Choctaw | 1.6 /100 | #231 | Tragic 5.6% |
| Moroccans | 1.6 /100 | #232 | Tragic 5.6% |
| Somalis | 1.5 /100 | #233 | Tragic 5.6% |
| Immigrants | Somalia | 1.5 /100 | #234 | Tragic 5.6% |
| Immigrants | Honduras | 1.5 /100 | #235 | Tragic 5.6% |
| Guatemalans | 1.2 /100 | #236 | Tragic 5.6% |
| Hondurans | 1.1 /100 | #237 | Tragic 5.6% |
| Native Hawaiians | 1.1 /100 | #238 | Tragic 5.6% |
| Immigrants | Guatemala | 1.1 /100 | #239 | Tragic 5.6% |
| Immigrants | Cameroon | 1.0 /100 | #240 | Tragic 5.6% |
| Salvadorans | 1.0 /100 | #241 | Tragic 5.7% |
Demographics Similar to Macedonians by Male Unemployment
In terms of male unemployment, the demographic groups most similar to Macedonians are Sri Lankan (5.2%, a difference of 0.010%), Immigrants from Kenya (5.2%, a difference of 0.010%), Syrian (5.2%, a difference of 0.020%), Immigrants from Burma/Myanmar (5.2%, a difference of 0.020%), and Fijian (5.2%, a difference of 0.050%).
| Demographics | Rating | Rank | Male Unemployment |
| Immigrants | Croatia | 79.7 /100 | #138 | Good 5.2% |
| Kenyans | 79.4 /100 | #139 | Good 5.2% |
| Brazilians | 79.3 /100 | #140 | Good 5.2% |
| Immigrants | Switzerland | 79.2 /100 | #141 | Good 5.2% |
| Fijians | 78.3 /100 | #142 | Good 5.2% |
| Syrians | 78.0 /100 | #143 | Good 5.2% |
| Sri Lankans | 77.9 /100 | #144 | Good 5.2% |
| Macedonians | 77.7 /100 | #145 | Good 5.2% |
| Immigrants | Kenya | 77.6 /100 | #146 | Good 5.2% |
| Immigrants | Burma/Myanmar | 77.5 /100 | #147 | Good 5.2% |
| Immigrants | Italy | 76.3 /100 | #148 | Good 5.2% |
| Immigrants | Europe | 76.2 /100 | #149 | Good 5.2% |
| Indians (Asian) | 76.0 /100 | #150 | Good 5.2% |
| Slovaks | 75.5 /100 | #151 | Good 5.2% |
| Egyptians | 74.8 /100 | #152 | Good 5.2% |